Econ 101: Intermediate Macroeconomic Theory Larry Hu
420 likes | 630 Vues
Econ 101: Intermediate Macroeconomic Theory Larry Hu. Lecture 2: The Data of Macroeconomics. Lecture Outline. In this chapter, you will learn about: Gross Domestic Product (GDP) the Consumer Price Index (CPI) the Unemployment Rate. How to Get Data. For US

Econ 101: Intermediate Macroeconomic Theory Larry Hu
E N D
Presentation Transcript
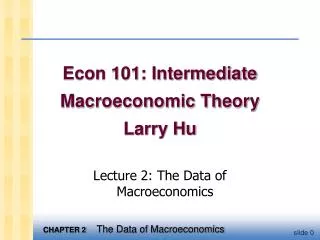
Econ 101: Intermediate Macroeconomic TheoryLarry Hu Lecture 2: The Dataof Macroeconomics
Lecture Outline In this chapter, you will learn about: • Gross Domestic Product (GDP) • the Consumer Price Index (CPI) • the Unemployment Rate
How to Get Data • For US Google “fred fed”, easy to make graph • For the World Google “WDI online” WDI means “world development indicator”
Gross Domestic Product Three definitions: • Total expenditure on domestically-produced final goods and services • Total income earned by domestically-located factors of production • The value of total output
Why expenditure = income In every transaction, the buyer’s expenditure becomes the seller’s income. Thus, the sum of all expenditure equals the sum of all income.
Some Tricky Points • Used good Not included in GDP • How about firms fail to sell one good Included in GDP, treat as “Inventories” • How about housing service? government will estimate the rent value and put it in GDP • Devil is in detail
How about those goods made in stages? GDP only includes value of final good A firm’s value added is the value of its output minus the value of the intermediate goods the firm used to produce that output.
Final goods, value added, and GDP • GDP = value of final goods produced = sum of value added at all stages of production • The value of the final goods already includes the value of the intermediate goods, so including intermediate goods in GDP would be double-counting.
The expenditure components of GDP • consumption • investment • government spending • net exports
Consumption (C) • durable goodslast a long time ex: cars, home appliances • non-durable goodslast a short time ex: food, clothing • serviceswork done for consumers ex: dry cleaning, air travel. def: the value of all goods and services bought by households. Includes:
Investment (I) Includes: • business fixed investmentspending on plant and equipment that firms will use to produce other goods & services • residential fixed investmentspending on housing units by consumers and landlords • inventory investmentthe change in the value of all firms’ inventories
Investment vs. Capital • Capital is one of the factors of production. At any given moment, the economy has a certain overall stock of capital. • Investment is spending on new capital. • Capital is Stock and Investment is Flow
Flow Stock Stocks vs. Flows stock flow a person’s wealth a person’s saving Debt owed to Foreigners Trade Deficit the govt. debt the govt. budget deficit More examples:
Government spending (G) • G includes all government spending on goods and services. • G excludes transfer payments (e.g. unemployment insurance payments), because they do not represent spending on goods and services.
Net exports (NX = EX - IM) def: the value of total exports (EX) minus the value of total imports (IM)
An important identity Y = C + I + G + NX where Y = GDP = the value of total output C + I + G + NX = aggregate expenditure
Suppose a firm • produces $10 million worth of final goods • but only sells $9 million worth. Does this violate the expenditure = output identity? • Unsold output goes into inventory, and is counted as “inventory investment”… …whether the inventory buildup was intentional or not.
GDP: An important and versatile concept We have now seen that GDP measures • total income • total output • total expenditure • the sum of value-added at all stages in the production of final goods
Real vs. Nominal GDP • GDP is the value of all final goods and services produced. • Nominal GDP measures these values using current prices. • Real GDP measure these values using the prices of a base year.
Real GDP controls for inflation Changes in nominal GDP can be due to: • changes in prices • changes in quantities of output produced Changes in real GDP can only be due to changes in quantities, because real GDP is constructed using constant base-year prices.
Practice problem, part 1 • Compute nominal GDP in each year • Compute real GDP in each year using 2001 as the base year.
GDP Deflator • The inflation rate is the percentage increase in the overall level of prices. • One measure of the price level is the GDP Deflator, defined as
Working with percentage changes USEFUL TRICK #1 For any variables X and Y, the percentage change in (XY) the percentage change in X+ the percentage change in Y EX: If your hourly wage rises 5% and you work 7% more hours, then your wage income rises approximately 12%.
Working with percentage changes USEFUL TRICK #2 the percentage change in (X/Y) the percentage change in Xthe percentage change in Y EX: GDP deflator = 100NGDP/RGDP. If NGDP rises 9% and RGDP rises 4%, then the inflation rate is approximately 5%.
Consumer Price Index (CPI) • A measure of the overall level of prices • Published by the Bureau of Labor Statistics (BLS) • Used to • track changes in the typical household’s cost of living • adjust many contracts for inflation (i.e. “COLAs”) (Cost-of-Living Adjustment) • allow comparisons of dollar figures from different years
How the BLS constructs the CPI • Survey consumers to determine composition of the typical consumer’s “basket” of goods. • Every month, collect data on prices of all items in the basket; compute cost of basket • CPI in any month equals
Exercise: Compute the CPI The basket contains 20 pizzas and 10 compact discs. prices: pizza CDs 2000 $10 $15 2001 $11 $15 2002 $12 $16 2003 $13 $15 For each year, compute • the cost of the basket • the CPI (use 2000 as the base year) • the inflation rate from the preceding year
answers: cost of inflation basket CPI rate 2000 $350 100.0 n.a. 2001 370 105.7 5.7% 2002 400 114.3 8.1% 2003 410 117.1 2.5%
Reasons why the CPI may overstate inflation • Substitution bias: The CPI uses fixed weights, so it cannot reflect consumers’ ability to substitute toward goods whose relative prices have fallen. • Introduction of new goods: The introduction of new goods makes consumers better off and, in effect, increases the real value of the dollar. But it does not reduce the CPI, because the CPI uses fixed weights. • Unmeasured changes in quality: Quality improvements increase the value of the dollar, but are often not fully measured.
The CPI’s bias • The Boskin Panel’s “best estimate”:The CPI overstates the true increase in the cost of living by 1.1% per year. • Result: the BLS has refined the way it calculates the CPI to reduce the bias. • It is now believed that the CPI’s bias is slightly less than 1% per year.
Categories of the population • employedworking at a paid job • unemployednot employed but looking for a job • labor force the amount of labor available for producing goods and services; all employed plus unemployed persons • not in the labor forcenot employed, not looking for work.
Two important labor force concepts • unemployment rate percentage of the labor force that is unemployed • labor force participation rate the fraction of the adult population that ‘participates’ in the labor force
Okun’s Law • Employed workers help produce GDP, while unemployed workers do not. So one would expect a negative relationship between unemployment and real GDP. • This relationship is clear in the data…
8 6 4 2 0 -2 -3 0 1 2 3 4 -1 -2 Okun’s Law Okun’s Law states that a one-percent decrease in unemployment is associated with two percentage points of additional growth in real GDP Percentage change in real GDP 10 1951 1984 2000 1999 1993 1975 1982 Change in unemployment rate
Chapter Summary • Gross Domestic Product (GDP) measures both total income and total expenditure on the economy’s output of goods & services. • Nominal GDP values output at current prices; real GDP values output at constant prices. Changes in output affect both measures, but changes in prices only affect nominal GDP. • GDP is the sum of consumption, investment, government purchases, and net exports.
Chapter Summary • The overall level of prices can be measured by either • the Consumer Price Index (CPI), the price of a fixed basket of goods purchased by the typical consumer • the GDP deflator, the ratio of nominal to real GDP • The unemployment rate is the fraction of the labor force that is not employed. When unemployment rises, the growth rate of real GDP falls.