Download
1 / 25
250 likes | 410 Vues
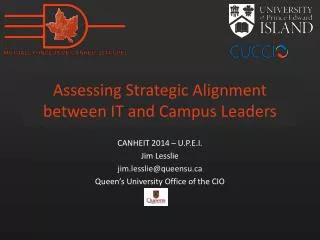
Assessing Strategic Alignment between IT and Campus Leaders. CANHEIT 2014 – U.P.E.I. Jim Lesslie jim.lesslie @queensu.ca Queen’s University Office of the CIO. Random attempt at humour…. Objectives. My new role: Assessment Specialist Outline our recent Assessment Pilot

E N D
Assessing Strategic Alignmentbetween IT and Campus Leaders CANHEIT 2014 – U.P.E.I. Jim Lesslie jim.lesslie@queensu.ca Queen’s University Office of the CIO
Objectives • My new role: Assessment Specialist • Outline our recent Assessment Pilot • Share why we think IT assessment is a developing requirement • Stimulate interest in this area • Identify opportunities to collaborate • Gain insights from CUCCIO members
For the CIOs in the room… • Do you get enough face time with your university’s leaders? • How often do you meet with them as a group to talk about IT? • Is Cost Containment a “push” from the top? • Have you/will you embrace an Activity-Based (aka Responsibility Centred) Budget Model? • Where does IT Report? Is there a “right” answer? • How different will your (IT) mandate be in 2019?
Dimensions of IT Assessment End User Satisfaction Business Alignment Benchmarking Organizational Advancement
End User Satisfaction Regular Assessment of: • How satisfied are faculty, staff and students with the IT services and functions provided? • What is the relative priority of each service or function we provide? • Are there gaps in our service offerings? Introduce new? Retire old? Value: • Monitor importance and effectiveness of core service areas • Identify unmet needs, areas to improve, shifting priorities Possible Tools: • In house developed customer satisfaction surveys • TechQual initiative • A CUCCIO-developed instrument ?
Benchmarking Annual Comparisons of: • IT funding, expenditures, staffing, etc. across PSE sector • Key metrics such as: • IT staff as % total university employees • IT expenditures as % of total university expenditures • Organizational structure and scope, technology profiles, governance Value: • Strengthen recommendations for additional funding, changes, etc. • Identify and track sector and technology trends • Identify sector “leaders” to keep an eye on? (are we one of them) Possible Tools: • Educause Core Data Service (global higher ed) • CUCCIO Benchmarking Service (Canadian universities) • Gartner annual benchmarking reports (IT industry)
Business Alignment Regular Alignment Review: • How well is IT aligned with the goals, priorities and operational needs of: • The major academic divisions (i.e. Faculties, Schools, the Library, etc.)? • The University overall, including administration and student services? • Ranking of importance of core service areas • Identify disconnects between the importance and capacity to meet needs Value: • Aggregation of perceptions and expectations re: importance, quality, etc. • Evidence-based decisions – e.g. biggest challenges; where to invest scarce $$ • Open line of communication with institution’s leaders Possible Tools: • Annual Survey of Institutional Leaders • Regular Town Halls or Planning Sessions
Organizational Advancement Annual Report Card: How are we Doing? • Progress made with our Strategic Plan (achievements, milestones, etc.) • How have we improved in targeted areas (e.g. customer service) • Is our organizational maturity advancing on track? Value: • We can show we are delivering what we said we would • We can show return on investment in IT (OpEx and CapEx) • We track our development as an IT organization over time • Conveys accountability to stakeholders Possible Tools: • Balanced Scorecard or similar process • Regular Reports tracking progress
Is IT Providing Value? VPs and Deans cannot relate to technical “metrics” typically reported by IT. They want metrics expressed in terms of Value for them.
InfoTech CIO Business VisionA possible Tool? • Standardized Survey Instrument for 13 core service areas • 28 Questions: • 21 Questions with a scale from 1 (Not at All) through 10 (Fully) • 1 Question ranking importance of 13 core service areas • 6 Open-Ended Questions for free-form responses • Target audience= Organization’s Leaders (VPs, Deans, Heads, IT Leaders) • Different objective than end user surveys. Assess or review… • Are IT services aligned with “business” requirements? • Priorities – what services are most important to them? • Gap Analysis – where does service capacity fall short, especially in their priority areas? • We provide InfoTech with a participants list & and some standard e-mail messages, and they do the rest • PDF Reports available to us immediately after survey closes • We also received the raw data (without the anonymous comments)
The Queen’s 2013 Pilot • Determine participants list (initially ~80, then expanded to 110) • Determine groupings • Level (VP, Director, Manager) • Faculty (each Faculty was a group, others in “Administration”) • Group 1 (DeptHead, DeptMgmt, Executive, Associate Dean, Dean, and EITAC) • Group 2 (Administration, Academic, SrAdmin) • Prepare messages from CIO for initial invitation and reminders • Launched first round in early June, closed after 2 weeks • Resumed in November with expanded audience
Pilot Experience • June 2013 Launch: • ~80 invitations to participate31 completed responses from ~80 invited • 31 complete and about 20 partial responses • Did not send invitations to VPs, Deans or Associate Deans • Resumed survey in November: • Those who had started but not finished were invited to do so • Invitations sent to VPs, AVPs, Deans and Associate Deans • Grand total of 49 responses (44%) from thirty departments • CIO began meeting with all respondents in January • The reports provided cues and seeded the opportunity • The follow-up conversations were enlightening • High level summary to be published for the campus soon
Questionnaire – Excerpts • Overall, considering all factors, how satisfied are you with the ITServices department and its ability to support your needs? [10=Fully Satisfied] • To what extent does your ability to deliver results depend on effective IT services? [10=Fully Dependent] • How satisfied are you that ITServices provides high value relative to cost and staffing? [10=Fully Satisfied] • What is your top suggestion for how ITServices can change or improve to better meet your needs? [Open ended] • How satisfied are you with the reliability, speed and access to WiFi provided by ITServices? [10=Fully Satisfied] • How satisfied are you with the reliability and effectiveness of the core communication, network infrastructure, and web portals that are available? [10=Fully Satisfied] • How satisfied are you with the PC, laptop, tablet and mobile devices available for faculty and staff? [10=Fully Satisfied] • How satisfied are you with the responsiveness and effectiveness of the IT Support Centre? [10=Fully Satisfied]
Questionnaire – ExcerptsContinued • What is the biggest opportunity for ITServices to better meet your teaching and learning support needs in classrooms and online? [Open ended] • How satisfied are you with the analytics capability you use to generate insights within your group? [1-10, 10=Fully Satisfied] • How satisfied are you with ITServices’s ability to begin and complete your requested IT customizations and small enhancements and work orders in a timely manner? [1-10, 10=Fully Satisfied] • To what extent is your group constrained and prevented from reaching your strategic goals by ITServices’s capacity? [1-10, 10=Very Constrained] • To what extent do you consider alternative (your own or external to the University) IT services and applications without ITServices’s involvement, due to lack of internal IT capacity? [1-10, 10=Consistently] • What is the greatest area of improvement to administrative applications provided by the University and the functionality they provide to support your group and run the institution? [Open ended] • Additional Comments. [Open ended. Anonymous response]
So What Did We get? 74 Page Report consisting of…. • Aggregate IT satisfaction and IT capacity scorecards • Service Gap Analysis – correlates satisfaction with capacity • Aggregate of all responses for all services • For each core service area • A summary of all responses from each department or office: • A metrics dashboard (satisfaction, value, rankings, etc.) • Free form, attributed comments (we know who said what) • Similar summaries by groupings we established in the participation list (e.g. by Faculty, such as Health Sciences) • Anonymous comments
Satisfaction & Importance This chart provides a high-level snapshot of how 49 of our campus leaders collectively regard IT. We believe that some of the low satisfaction levels are due to gaps in our Admin systems and that they are still in their early years.
Capacity vs. Dependency This paints a pretty clear picture of the gap between the Capacity of our services, the Dependency stakeholders have on those services, and a potential outcome if that gap is significant and/or persists.
Distribution of ResponsesOperational vs. Project Day to Day Requests/Needs Support Score is the proportional difference between # of supporters and # of detractors. Significant Project Requirements
Service Gap Scores Comparison of Satisfaction vs. Importance for all core services. Underserved The size of each bar visually depicts the gap between the importance of that core service and the satisfaction with the capacity of that service as currently provisioned. Potentially Overprovisioned We regard this graphic as probably the most useful of all the results provided. It seems to resonate well when reviewed with Stakeholders.
Lessons Learned • Need to provide more direction for respondents: Decide what their responses should reflect: • Based on the experience and needs of their faculty or department, or • What they feel is best for Queen’s overall • Provide more guidance We heard that some people were unsure how to respond to some questions. Vocabulary did get in the way. • Follow up – Close the loop so they see it as worthwhile. • Perhaps the greatest value from the entire exercise was the new relationships it seeded and the proactive dialogue this enabled the CIO to have. • And finally …..
Lessons Learned – Con’t Don’t Call It A Survey !!!
Wrapping up… • The InfoTech CIO Business Vision tool may not be the most effective for the long run • But we believe there is value in having this type of process to engage leaders and assess alignment with them • Outcomes can be better with improved guidance, more buy-in, and better positioning of what the goal is • Regardless of the tool used, this process will not yield hard answers or clear direction • The value comes in the Cues, Clues and Confirmation the process can provide, and the Connections it seeds Might there be value in a common CUCCIO tool for assessing Alignment??