Drug Therapy
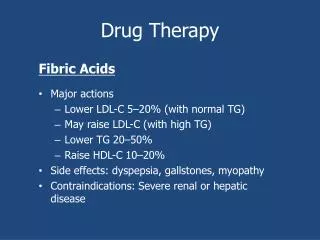
Drug Therapy. Fibric Acids Major actions Lower LDL-C 5–20% (with normal TG) May raise LDL-C (with high TG) Lower TG 20–50% Raise HDL-C 10–20% Side effects: dyspepsia, gallstones, myopathy Contraindications: Severe renal or hepatic disease.

Drug Therapy
E N D
Presentation Transcript
Drug Therapy Fibric Acids • Major actions • Lower LDL-C 5–20% (with normal TG) • May raise LDL-C (with high TG) • Lower TG 20–50% • Raise HDL-C 10–20% • Side effects: dyspepsia, gallstones, myopathy • Contraindications: Severe renal or hepatic disease
Number of Cases of Rhabdomyolysis in Combination Therapy With Statins* 10 8.6 9 8 7 15-Fold Increase 6 No. Cases Reported per Million Prescriptions 5 4 3 2 0.58 1 0 Fenofibrate Gemfibrozil *Excludes cases involving cerivastatin Jones PH, et al. Am J Cardiol. 2005;95:120-122.
Statin Alone vsStatin + Ezetimibe 5%-6% 5%-6% 5%-6% 3-STEP TITRATION Statin – starting dose 1st 2nd 3rd Doubling 25% + Ezetimibe 10 mg 1-STEP COADMINISTRATION Statin – starting dose % Reduction in LDL-C Adapted from Illingworth DR, et al. Curr Med Res Opin 2001;17:43-50.
Omega-3 Acid Ethyl Esters:How Do They Lower TG? • How do they work? • Inhibit synthesis of VLDL and TG in the liver • Increase rate of hepatic fatty acid oxidation • Benefit • Reduce serum TG; lower risk of cardiac sudden death and all-cause mortality; mildly lower BP; reduce inflammatory and thrombotic risk • How used? • 1-4 g/d by mouth, alone or combined with statin; no drug interactions or clinically important adverse effects Berge RK et al. Biochem J. 1999;343:191-197; Covington MB. Am Fam Physician. 2004;70:133-140. Ren B et al. J Biol Chem. 1997;272:26827-26832; Madsen L et al. Lipids. 1999;34:951-963; Willumsen N et al. J Lipid Res. 1993;34:13-22;Harris WS et al. Am J Clin Nutr. 1997;66:254-260; Lu G et al. J Nutr Biochem. 1999;10:151-158.
Omega-3 Acid Ethyl Ester Dosing • 1 g omega-3 acid ethyl ester capsule contains:465 mg EPA + 375 mg DHA • Dose for hypertriglyceridemia (>499 mg/dL) • 4 g: 4 capsules once a day or 2 capsules twice a day with or without meals DHA = docosahexaenoic acid; EPA = eicosapentaenoic acid. Available at: www.omacorrx.com/HCP-OMACOR/OMACOR_Dosing.html. Accessed February 13, 2007.
Summary: Omega-3 Fatty Acids and Hypertriglyceridemia • Omega-3 fatty acids from fish protect against heart disease • A dose of 4 g/d (acid ethyl esters) effectively lowers TG • Can be safely combined with statins • Have no known drug-drug interactions • May prolong bleeding time in some patients • Are not contaminated with mercury • Endorsed by the American Heart Association Covington MB. Am Fam Physician. 2004;70:133-140.
GISSI-Prevenzione TrialEarly Effect on All-Cause Mortality (n = 11,324 post-MI) 1.00 Omega-3 Acid Ethyl Esters (850 mg/d) 0.99 0.98 Probability 0.59 (95% CI, 0.36-0.97) P = .037 0.97 Control 0.96 0.95 30 120 360 150 0 90 180 210 270 330 240 300 60 Days Marchioli R et al. Circulation. 2002;105:1897-1903.
American Heart Association Fish Oil Recommendations Kris-Etherton et al. Circulation. 2002;106:2747-2757.
Homocysteine as a CV Risk • HOPE investigators randomized 5522 pt’s >55 yrs of age with vascular disease or DM to (folic acid, Vitamin B6, and Vitamin B12) vs. placebo for 5 years “No reduction of CV events” • NORVIT investigators randomized 3749 pt’s who had AMI in past 7d to varying schedule of (folic acid, Vitamin B6, and Vitamin B12) vs. placebo for median follow-up of 40 months “No reduction of CV events” HOPE NEJM 2006;354:1567-1577 Bonaa et al. NEJM 2006;354:1578-1588.
Results of Statin Trials MIRACL (ACS)– 16% Event Reduction PROVE-IT (ACS)– 16% Death/CV event A to Z (ACS)– No significant event reduction CARDS – 37% event reduction ASCOT LLA (HTN 3+RF ) – 36% event reduction HPS (S-CAD) – 24% event reduction IDEAL (S-CAD) – 11% non-significant event reduction TNT (S-CAD) - 22% RRR
Cholesterol Treatment Trialists’ (CTT) Meta-Analysis Major Vascular Events All-Cause Mortality Coronary Mortality Stroke Reduction in Incidence ( %) Baigent C, et al. Lancet. 2005;366:1267-1278.
4S LIPID 20 1.00 Placebo Simvastatin 0.95 15 Placebo 0.90 Fatal CHD/nonfatalMI (%) Proportion alive 10 Pravastatin 0.85 5 Risk reduction, 30%Log-rank p=0.0003 Risk reduction, 24%p<0.001 0.80 0.00 0 0 1 2 3 4 5 6 0 1 2 3 4 5 6 7 CARE 15 10 Placebo Fatal CHD/nonfatalMI (%) Pravastatin 5 Risk reduction, 24%p=0.003 0 0 1 2 3 4 5 6 Years Early secondary prevention trials only focussed on long-term event reductions in stable patients 4S Study Group. Lancet 1994;344:1383–1389. Sacks FM et al. N Engl J Med 1996;335:1001–1009. LIPID study group. N Engl J Med 1998;339:1349–1357.
30 25 20 Patients With CHD Events, % 15 10 5 0 70 90 110 130 150 170 190 210 LDL-C, mg/dL Relationship of CHD Events and LDL on Rx 4S-P 4S-S LIPID-P CARE-P LIPID-S HPS-P CARE-S HPS-S TNT: Atorvastatin 10 mg TNT: Atorvastatin 80 mg S = statin treated P = placebo treated (1.8) (2.3) (2.8) (3.4) (3.9) (4.4) (4.9) (5.4) LaRosa J et al. N Engl J Med. 2005;352:1425-1435.
Cholesterol Lowering and Major Coronary Events in Primary Prevention Statin Trials 5 Year MCE (%) ASCOT CARDS ASCOT CARDS WOS-C AFCAPS-C WOS-T AFCAPS-T Control and Treatment LDL-C (mg/dL) Adapted from Ballantyne.
HPS: Key Findings CHDEvents All-causeMortality 5 0 –5 Average Change From Baseline at End of Study (%) –10 –15 –13% P = .0003 –20 –25 –30 –27% N = 20,536 P <.0001 HPS Collaborative Group. Lancet. 2002;360:7-22.
MIRACL: primary efficacy measure Placebo 17.4% 15 14.8% Atorvastatin • Time to first occurrence of: • Death (any cause) • Nonfatal MI • Resuscitated cardiac arrest • Worsening angina with new objective evidence requiring urgent rehospitalization 10 Cumulative Incidence (%) Relative risk = 0.84p=0.048 5 0 0 4 8 12 16 Time since randomization (weeks) Data on file, Pfizer Inc.
Pravastatin 40 mg 537/2063 (26.3%) Baseline median LDL 106 mg/dL; 95 mg/dL at conclusion 30 25 20 Atorvastatin 80 mg 464/2099 (22.4%) Baseline median LDL 106 mg/dL; 62 mg/dL at conclusion % with event N = 4,162 15 10 16% RRR at 2 years (P = 0.005) 5 0 0 30 3 6 9 12 15 18 21 24 27 Months of follow-up PROVE-IT: Lower Is Better Cannon CP, et al. N Engl J Med 2004;350:1495-1504.
PROVE-IT: Take-Home Message • High-dose LDL-lowering regimen reduced risk of all-cause mortality or major cardiac events by 16% • Benefits emerged approximately 30 days after event • Benefit observed throughout 2.5-year follow-up • Benefits consistent across all cardiovascular endpoints, except stroke Cannon CP, et al. N Engl J Med 2004;350:1495-1504.
CHD Reduction in Secondary Prevention Trials Pedersen et al. Circulation. 1998;97:1453-1460. LIPID Study Group. N Engl J Med. 1998;339:1349-1357. Sacks et al. Circulation. 1998;97:1446-1452. HPS Collaborative Group. Lancet. 2002;360:7-22. Waters et al. Am J Cardiol. 2004;93:154-158.
All-Cause Mortality in Secondary Prevention Trials • Lower event rate in TNT reduces power to detect treatment effect. *Significant effect on all-cause mortality †Atorvastatin 10 mg Pedersen et al. Circulation. 1998;97:1453-1460. LIPID Study Group. N Engl J Med. 1998;339:1349-1357. Sacks et al. Circulation. 1998;97:1446-1452. HPS Collaborative Group. Lancet. 2002;360:7-22. Waters et al. Am J Cardiol. 2004;93:154-158.
REVERSAL: % Change in Atheroma Volume Progression (P = 0.001*) 3 Pravastatin 2.5 Atorvastatin 2.7 2 P = 0.02† 1.5 % change atheroma volume 1 No change (P = 0.98*) 0.5 0 -0.4 -0.5 -1 Nissen SE, et al. JAMA 2004;29:1071-1080.
Can an “ASTEROID”Regress Coronary Disease? • IVUS study of 349 patients with >20% & <50% plaque at baseline and re-IVUS at 2yrs • Intensive statin therapy with rosuvastatin 40mg q.d. x 2yrs • Mean decrease in LDL-C 53% • Mean increase of HDL-C 15% • Modest plaque regression 6.8% JAMA 2006: published online March 13, 2006
Generic/Brand Names of the Common Statins Crestor® rosuvastatin AstraZeneca Lescol® fluvastatin Novartis Lipitor® atorvastatin Pfizer Mevacor® lovastatin Merck Pravachol® pravastatin Bristol-Myers Squibb Zocor® simvastatin Merck
Simvastatin Rosuvastatin Pravastatin Atorvastatin Yes Yes No No No No Yes Yes Dual renal / hepatic Dual renal / hepatic Dual renal / hepatic Primarily hepatic No Yes Yes No 20% 17% <5% 14% 19 77 1.9 14 Pharmacokinetic Profile of Common Statins Relatively Hydrophilic Clinically Significant Metabolites Plasma Clearance CYP450 3A4 Metabolism Bioavailability Elimination Half-life* (hours) *Elimination T1/2 of drug and metabolites, if any. Source: Prescribing information for pravastatin,rosuvastatin, atorvastatin, and simvastatin.
Pravastatin Atorvastatin Rosuvastatin Simvastatin 0 –10 –20 –30 –40 –50 –60 STELLAR: % Change in LDL-C N = 2,240 Dose 10 mg 20 mg 40 mg 80 mg Mean Percent Change From Baseline in LDL-C Jones PH, et al. Am J Cardiol. 2003;93:152-160.
Potency Comparison of the Statins Fluva 10 20 40 80 Lova 10 20 40 80 Prava 10 20 40 80 Simva 10 20 40 80 Atorva 10 20 40 80 Resuva 5 10 20 40 0 10 20 30 40 50 60 Expected % reduction in LDL
† 9.6 ** 9.5 * 7.7 12 6.8 10 6.0 5.7 5.6 5.3 5.2 4.8 4.4 4.4 8 3.2 6 2.1 4 2 10 20 40 Rosuvastatin (mg) 0 STELLAR: % Change in HDL-C Mean Percent Change From Baseline in HDL-C 10 20 40 10 20 40 80 10 20 40 80 Pravastatin (mg) Simvastatin (mg) Atorvastatin (mg) *P <.002 vs prava 10 mg **P <.002 vs atorva 20 mg, 40 mg, 80 mg; simva 40 mg; prava 20 mg, 40 mg † P <.002 vs atorva 40 mg, 80 mg; simva 40 mg; prava 40 mg Jones PH et al. Am J Cardiol . 2003;93:152-160.
Rosuvastatin (mg) 10 20 40 10 20 40 80 10 20 40 0 10 20 40 80 -5 -10 -11.9 -14.8 -15 -17.6 -18.2 -19.8 * -20 -20 -22.6 -23.7 ** -25 -26.1 † -26.8 -28.2 -30 STELLAR: % Change in Triglycerides Pravastatin (mg) Simvastatin (mg) Atorvastatin (mg) -7.7 -8.2 Mean Percent Change From Baseline in TG Levels -13.2 *P <.002 vs prava 10 mg, 20 mg **P <.002 vs simva 40 mg; prava 20 mg, 40 mg † P <.002 vs simva 40 mg; prava 40 mg Jones PH et al. Am J Cardiol . 2003;93:152-160.
Focused Treatment for Hypertriglyceridemia NCEP ATP III. Circulation. 2002;106:3143-3421.
Focused Treatment for Hypertriglyceridemia (cont’d) NCEP ATP III. Circulation. 2002;106:3143-3421.
Specific Dyslipidemias: Elevated Triglycerides (150 mg/dL) Causes of Elevated Triglycerides • Obesity and overweight • Physical inactivity • Cigarette smoking • Excess alcohol intake
Specific Dyslipidemias: Elevated Triglycerides Causes of Elevated Triglycerides (continued) • High carbohydrate diets (>60% of energy intake) • Several diseases (type 2 diabetes, chronic renal failure, nephrotic syndrome) • Certain drugs (corticosteroids, estrogens, retinoids, higher doses of beta-blockers) • Various genetic dyslipidemias
Predictors of Adherence With Concomitant Antihypertensive and Lipid-Lowering Medications Therapy Initiation* Demographics* Start AH-T/LL-T(0-30 d) 1.00 (ref group) Age (18-44) 1.34 (P <.001) Age (55-64) 1.56 (P <.001) Start AH-T/LL-T(31-60 d) 1.09 (P = .25) 1.27 (P = .004) Age (65-74) Start AH-T/LL-T(61-90 d) 1.00 (ref group) Sex (Female) 0.91 (P = .02) No. of Concomitant Meds* 0 1.96 (P <.001) No CAD 1.00 (ref group) 1 1.61 (P <.001) CAD Level 1 (angina or coronary angiography) 0.96 (P = .73) 2 1.30 (P <.001) CAD Level 2 (PTCA, CABG or chronic CHD) 3-5 1.20 (P = .001) 1.23 (P <.001) ³ 6 1.00 (ref group) 1.28 (P = .003) CAD Level 3 (acute MI) 0.5 1 2.0 2.5 0.5 1 2.0 2.5 Adherent Nonadherent Adherent Nonadherent *Odds ratio (95% CI) AH-T = antihypertensive therapy; LL-T = lipid-lowering therapy; CAD = coronary artery disease. Chapman RH et al. Arch Intern Med. 2005;165:1147-1152.
Metabolic Syndrome? C-Reactive Protein? Interleukin-6? Particle size? Triglycerides? Lipoprotein remnants? Non-HDL? HDL infection? Impaired Fasting Glucose? Homocysteine? Thrombogenic Factors? ESR? B-Natriuretic Peptide? Fibrinogen? ? Emerging Risk Factors
Ridker et al. 15,632 women >45 yrs w/o CVD Showed Non-HDL-C level highly correlated with apoB in CVD risk prediction Pischon et al. 18,225 men 40-75 yrs w/o CVD Showed apoB was the strongest predicators The Debate:LDL Vs. Non-HDL Vs. apoB Now the questionis: Whether the additional cost of measuring apoB justify any benefit of improved risk prediction over currently available methods Ridker et al. JAMA. 2005;294:326-333. Pischon et al. Circulation 2005;112:3375-3383. Cushman et al. Circulation. 2005;112:25-31.
CRP> 10 mg/L Infection Autoimmune disease / CA Pregnancy Rheumatoid arthritis SLE Crohn’s disease CRP risk: Low =<1 mg/L Average =1-3 mg/L High =>3 mg/L Exercise Weight Loss Smoking Cessation BP Control Diet/Glucose Control Statins ASA / COX-1. -2 ACE I Fibrates Niacin Circulation 2003;107:499-511
C-Reactive Protein for Secondary Prevention in ACS • PROVE IT-TIMI 22 investigators found: • A correlation between LDL-C and CHD events as well as HS-CRP and CHD events in very high risk patients. • That LDL-C and HS-CRP are independent markers of risk and each should be viewed and treated to desirable goals Ridker PM, et al. NEJM Vol352(1) Jan 6, 2005 pp 20-28
Emerging Risk Factors:CRP and Recurrent MI, CHD Death Ridker PM et al. N Engl J Med. 2005;352:20-28. Nissen et al. N Engl J Med. 2005;352:29-38.
89,890 Screened 89,863 Screened Reason for Exclusion (%) LDL > 130 mg/dL 52 hsCRP < 2.0 mg/L 36 Withdrew Consent 5 Diabetes 1 Hypothyroid <1 Liver Disease <1 TG > 500 mg/dL <1 Age out of range <1 Current Use of HRT <1 Cancer <1 Poor Compliance/Other 3 Men > 50 years Women > 60 years No CVD, No DM LDL < 130 mg/dL hsCRP > 2 mg/L 4 week Placebo Run-In 17,802 Randomized 17,802 Randomized 8,901 Assigned to Rosuvastatin 20 mg 8,901 Assigned to Placebo 8,901 Assigned to Rosuvastatin 20 mg 8,901 Assigned to Placebo 8,857 Completed Study 44 Lost to follow-up 8,864 Completed Study 37 Lost to follow-up 8,600 Completed Study 120 Lost to follow-up 8,600 Completed Study 120 Lost to follow-up 8,901 Included in Efficacy and Safety Analyses 8,901 Included in Efficacy and Safety Analyses 8,901 Included in Efficacy and Safety Analyses 8,901 Included in Efficacy and Safety Analyses Jupiter Study Design Ridker PM, et al. N Engl J Med. 2008;359:2195-2207.
Primary Endpoint: MI, Stroke, UA/Revascularization, CV Death HR 0.56, 95% CI 0.46-0.69 P < 0.00001 Placebo251 / 8901 0.08 0.06 - 44% Cumulative Incidence 0.04 Rosuvastatin 142 / 8901 0.02 0.00 0 1 2 3 4 Follow-up (years) Number at Risk Rosuvastatin 8,901 8,631 8,412 6,540 3,893 1,958 1,353 983 544 157 Placebo 8,901 8,621 8,353 6,508 3,872 1,963 1,333 955 534 174 Ridker PM, et al. N Engl J Med. 2008;359:2195-2207.
Treatment of the Elderly • HPS 20,536 pt’s with prior CVD, TC > 135mg/dl 28% of whom were 70-80 yrs of age • Those who were 80-85 yrs of age at end of trial had a 29% reduction of CV event with statins • PROSPER 5,804 pt’s at high risk for CVD and stroke, 70-82 yrs of age, TC btw 155-348mg/dl • Treatment produced 15% reduction in death from CVD, nonfatal MI, & fatal/nonfatal stroke • Aronow et al. observational study of 1410 pt’s mean age of 81 years, prior MI, and LDL-C > 125mg/dl • Pt’s treated with statin had 46% event rate vs. 72% for placebo treated pt’s. All age groups (60-70,71-80,81-90,91-100) were found to have clinically significant reductions HPS Lancet 2002;360:7-22 Shepherd et al. Lancet 2002;360:1623-1630. Aronow Am J Cardiol 2002;89:76-69.
What percentage of MI has a BMI >30 or is 30 lbs overweight? • < 10% • 10-14% • 15-19% • 20-24% • 25-29% • >30%
Obesity Trends* Among U.S. AdultsBRFSS, 1990, 1998, 2006 (*BMI 30, or about 30 lbs. overweight for 5’4” person) 1998 1990 2006 No Data <10% 10%–14% 15%–19% 20%–24% 25%–29% ≥30%
Metabolic Syndrome Definitions:NCEP ATP III and IDF IDF: International Diabetes Federation 1. Grundy SM, et al. Circulation. 2005;112:2735-2752. 2. International Diabetes Federation. Rationale for new IDF worldwide definition of metabolic syndrome. Available at http://www.idf.org/webdata/docs/Metabolic_syndrome_rationale.pdf.Accessed on February 3, 2007.
Prevalence of Metabolic Syndrome Among US Adults Prevalence Age in Years Ford E, et al. JAMA 2002;287:356-359.
Safety of Lovastatin/Niacin ER and Niacin ER vs Statin Monotherapy (FDA-AERS) * *P <.05 versus L/N * Serious AERs Per Million Prescriptions * Liver AERs Per Million Prescriptions Rhabdomyolysis AERs Per Million Prescriptions A = atorvastatin; AERs = adverse event reports; FDA-AERS = US Food and Drug Administration Adverse Event Reporting System; L = lovastatin; N = niacin ER; P = pravastatin; S = simvastatin. Alsheikh-Ali AA, et al. Am J Cardiol. 2007;99:379-381.
SAFARI Study:Fenofibrate + Statin Combination Therapy * Change from baseline (%) * * * HDL-C VLDL-C LDL-C TG N = 618*P <.001 vs simvastatin. Grundy SM , et al. Am J Cardiol. 2005;95:462-468.
100 20 Placebo 80 Fenofibrate 10 60 Proportion with Event (%) 0 40 0 1 2 3 4 5 6 7 8 20 0 3 1 2 4 5 6 7 8 0 Years ACCORD – Lipid StudyPrimary Outcome p=0.32 # at Risk Ginsberg H. N Engl J Med. 2010; 362:17 1563-1574.