
Analyzing the Impact of Student Expenditure on Graduation Rates in U.S. Public Universities
This study investigates the linear relationship between student-related expenditures and six-year graduation rates at primarily undergraduate public universities in the U.S. using regression analysis. We hypothesize that increased expenditures positively predict graduation rates (H0: b = 0, Ha: b > 0). After conducting a linear regression t-test, we find significant evidence to reject H0, indicating that expenditure does predict graduation rates. The regression equation and R-Squared value further enhance understanding of this relationship, providing insights for educational stakeholders.

Analyzing the Impact of Student Expenditure on Graduation Rates in U.S. Public Universities
E N D
Presentation Transcript
Formulas: • Hypothesis test:
The data on six-year graduation rate (%), student-related expenditure per full-time student, and median SAT score for a random sample of the primarily undergraduate public universities in the US with enrollments between 10,000 and 20,000 were taken from College Results Online, The Education Trust. We would like to know if there is . For a test of a linear relationship, the null hypothesis is usually expressed as: In this context, this means
Conjecture: We suspect that increased expenditures can be used to predict graduation rates. H0: b = 0 Where b is the true slope between expenditures and graduation rates. Ha: b > 0
Assumptions : • Have an SRS of colleges • Since the residual plot is randomly scattered, Expenditures and Grad rates are linear • Since the points are evenly spaced across the LSRL on the scatterplot, sy is approximately equal for all values of grad rate • Since the boxplot of residual is approximately symmetrical, the responses are approximately normally distributed.
Test statistic: Linear Regression t-test Since the p-value < a, I reject H0. There is sufficient evidence to suggest that expenditures can be used to predict graduation rate.
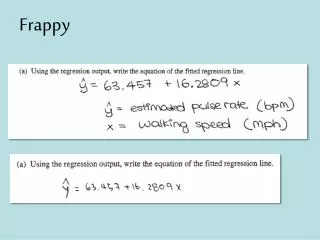
Now for some computer output Give the equation of the line, in the context of the problem.