North Patch
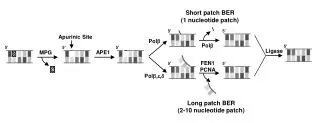
North Patch. South Patch. 1. 2. 8. North Patch. 3. 4. 5. 6. 7. South Patch. Large Volume in-situ Filtration During SOFeX: an Overview of Results for Large (>51 m m) Particles. AGU 2002 Fall Meeting. Paper #OS11A-0218 Phoebe J. Lam, 1,2 Todd J. Wood, 2 James K.B. Bishop, 1,2

North Patch
E N D
Presentation Transcript
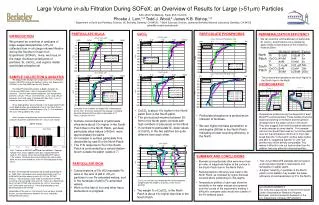
North Patch South Patch 1 2 8 North Patch 3 4 5 6 7 South Patch Large Volume in-situ Filtration During SOFeX: an Overview of Results for Large (>51mm) Particles AGU 2002 Fall Meeting. Paper #OS11A-0218 Phoebe J. Lam,1,2 Todd J. Wood,2 James K.B. Bishop,1,2 1 Department of Earth and Planetary Science, UC Berkeley, Berkeley, CA 94720; 2 Earth Sciences Division, Lawrence Berkeley National Laboratory, Berkeley, CA 94720 pjlam@socrates.berkeley.edu PARTICULATE SILICA CaCO3 PARTICULATE PHOSPHORUS REMINERALIZATION EFFICIENCY INTRODUCTION We present an overview of analyses of large suspended particles (>51mm) collected from in-situ large volume filtration during the Southern Ocean Iron Experiment (SOFeX). Here, we focus on the major chemical constituents of particles: Si, CaCO3, and organic matter (particulate phosphorus). • We can examine remineralization of particulate Si, CaCO3, and phosphorus by comparing approximate concentrations at the surface to those at 200m: SAMPLE COLLECTION & ANALYSIS We deployed the Multiple Unit Large Volume in-situ Filtration System (MULVFS) during the Southern Ocean Iron Experiment (SOFeX) in Jan/Feb 2002 from the R/V Revelle. The MULVFS collected samples at depths between the surface and 1000m over 4 hours of pumping from 3 flow channels. The main flow channel collected size-fractionated particles (>51mm, 1-51mm, and nominally <1mm) using a 51mm polyester mesh and a pair of microquartz fiber filters (1mm) in sequence from up to 12,000L of seawater. Three depth profiles were collected in the Si-poor North Patch, and 5 depth profiles were collected in the Si-rich South Patch, inside and outside of Fe-fertilized waters (Fig.1). The location of the casts were guided by SF6 values. Here, we focus on preliminary results from bulk chemical analyses of particles collected from the > 51mm size fraction. • The concentration gradients are much higher in the South than in the North HYDROGRAPHY Variability in the numbers are largely due to heterogenity on the filter. Error bars represent the average %standard deviation determined from repeat subsamples of 17 filters (%std.dev.=3.91%). • CaCO3 is about 10x higher in the North patch than in the South patch. • The pronounced maxima between 35-90m in the North patch coincide with high numbers of pteropods on the filters • In contrast to particulate Si, deep values of CaCO3 in the two patches are quite different from each other. Temperature profiles during the downcast of each MULVFS cast are plotted. These profiles show the seasonal warming in the North and the general development of the water column in the South. They also suggest that there was lateral advection of water masses at some depths. For example, cast 6 in the South Patch was an “out of the patch” cast, but the temperature minimum is much less broad than the “in the patch” profiles taken before and after it, suggesting that the “in” and “out” profiles may not be directly comparable. This makes it difficult to rule out factors other than Fe addition that may affect the chemical profiles. • Particulate phosphorus is plotted as an indicator of biomass. • We see higher biomass penetration to mid depths (500m) in the North Patch, indicating a lower recycling efficiency in the North. • Surface concentrations of particulate silica were about 10x higher in the South Patch than in the North Patch, yet deep particulate silica values (>500m) were approximately the same. • An increase in surface particulate Si is discernible by cast 8 in the North Patch. • The P-Si response to Fe in the South Patch is confounded by a natural diatom bloom outside the patch (casts 4-7) Fig.1. Timeline of MULVFS casts and iron additions. Red bars indicate times of iron addition. Blue bars indicate MULVFS casts in “-Fe” waters. Green bars indicate MULVFS casts in “+Fe” waters. Numbers above bars indicate the cast number. Note: we may have drifted out of the Fe-fertilized patch during cast 2. SUMMARY AND CONCLUSIONS • The >51mm MULVFS samples did not record a strong export signal in response to iron fertilization in either patch. • A higher %CaCO3 in particles in the North patch (more ballast) may explain the lower efficiency of remineralization of P in the North. • Biomass and particulate silica were more than an order of magnitude higher at the surface in the South Patch than in the North Patch. • Remineralization efficiency was lower in the North Patch, as indicated by higher biomass concentrations penetrating to mid-depths. • Temperature profiles of each cast show the variability in the water masses encountered over the course of the experiment, making it difficult to compare casts inside and outside of the Fe-fertilized patch. PARTICULATE IRON • Concentrations of 5% HCl leachable Fe were in the tens of pM in >51mm particles in non Fe-amended waters, and in the hundreds of pM in Fe-amended waters. • Work on the fate of iron and other trace elements is in progress… All filters were prepared and processed according to Bishop et al. 1985. Filter subsamples were leached overnight at 60°C in 0.5N NaOH for silica analysis and in 5% HCl for ICP-MS analysis. Salt corrections were made using Na from ICP-MS, assuming a Na:salt weight ratio of 3.25. CaCO3 was determined from Ca from ICP-MS after correction for salt Ca, assuming a salt Ca:Na molar ratio of 0.02. Particulate phosphorus was determined from the ICP-MS. Magnitudes of the errors in the analyses have not been worked out yet, so small differences between the casts should be interpreted with caution. CaCO3 on the filter was divided by the salt-corrected dry weight to get the weight % of CaCO3 in the >51mm particles ACKNOWLEDGEMENTS This work was supported by funds from the Ocean Carbon Sequestration Research Program, Biological, and Environmental Research of the U.S. Department of Energy [KP1202030]. • The weight % of CaCO3 in the North Patch is about 10x higher than that in the South Patch.