Understanding Market Structures: Pure Monopoly and its Characteristics
This chapter delves into the complexities of pure monopoly as a market structure. It highlights the defining features of monopolistic markets, including a single seller, absence of close substitutes, and price-making abilities. We discuss barriers to entry, such as economies of scale and legal restrictions, as well as the unique demand dynamics monopolists face. The implications of monopoly on revenue, costs, and pricing strategies are examined, alongside an analysis of profit maximization rules for monopolists, contrasting with competitive market scenarios.

Understanding Market Structures: Pure Monopoly and its Characteristics
E N D
Presentation Transcript
24 C H A P T E R Pure Monopoly
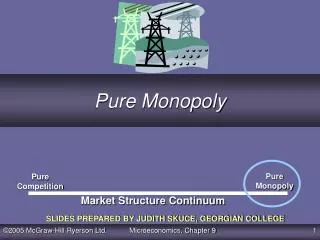
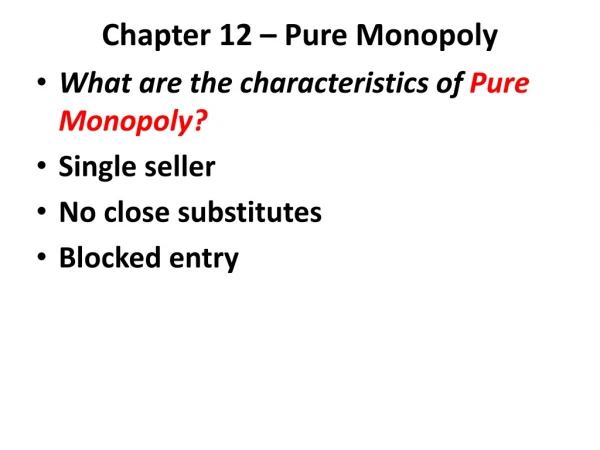
Pure Monopoly Pure Competition Monopolistic Competition Oligopoly FOUR MARKET MODELS Pure Monopoly: • Single Seller • No Close Substitutes • Price Maker • Blocked Entry • Nonprice Competition
BARRIERS TO ENTRY • Economies of Scale • The Natural Monopoly Case • Legal Barriers to Entry • Patents / Licenses • Ownership or Control of Essential Resources • - Pricing and Other Strategic barriers to entry
MONOPOLY DEMAND • 3 Basic Assumptions: • 1. Monopoly Status is Secure • 2. No Governmental Regulation • 3. Firm Charges the Same Price for all Units Sold • Market Demand Curve is the Firm’s Demand Curve
The monopolist sets the price in the elastic region of demand • In the elastic regionof demand lower price leads to higher total revenue • The monopolist avoids the inelastic regionin the demand curve.
In competitive markets: • Demand is perfectly elastic demand • Each unit sold will add the amount of constant product price to total revenue. • P = MR(constant) • In pure monopoly: • The monopolist is the market • The demand is the market demand • The demand is downward sloping • Qd increases as P decreases
MONOPOLY REVENUES & COSTS Revenue Data Quantity of Output Price (Average Revenue) Marginal Revenue 0 1 2 3 4 5 6 7 8 9 10 $172 162 152 142 132 122 112 102 92 82 72 $162 142 122 102 82 62 42 22 2 - 18
MONOPOLY REVENUES & COSTS Revenue Data Quantity of Output Price (Average Revenue) Marginal Revenue 0 1 2 3 4 5 6 7 8 9 10 $172 162 152 142 132 122 112 102 92 82 72 Note that P > MR (except 1 unit) $162 142 122 102 82 62 42 22 2 - 18
$ MC D MR Q
$ MC MC = MR MR D MR Q* Q
$ MC MC = MR Pm MR Recall P>MR! D MR Q* Q
$ MC MC = MR Pm MR Recall P>MR! D MR Q Q*
Note that ATC minimum = (MR=MC) $ MC Pm ATC MR D MR Q
Profit maximization rule of monopolist MR = MC And MC ≠ P • Note that price > MR • Loss minimization rule MR = MC
The monopolist has no supply curve (MC ≠ P) • The monopolist equates MR and MC to determine output • The monopolist does not set the highest possible price. Monopolist goal is maximum profit not maximum price. • Higher price may lead to less profit.
MONOPOLY REVENUES & COSTS Revenue Data Cost Data Quantity of Output Price (Average Revenue) Average Total Cost Profit + or loss - Total Revenue Marginal Revenue Total Cost Marginal Cost - x 0 $172 $ 0 $100 - $100 = =
] ] MONOPOLY REVENUES & COSTS Revenue Data Cost Data Quantity of Output Price (Average Revenue) Average Total Cost Profit + or loss - Total Revenue Marginal Revenue Total Cost Marginal Cost 0 1 0 $172 $172 162 $ 0 162 $ 0 $100 $100 190 - $100 - $100 - 28 90 $162 - x = = $190.00 MC = $190 – 100 = $90 MR = $162 – 0 = $162 MR > MC Loss Improvement from -$100 to -$28 Check next unit of output!
] ] ] ] ] ] ] ] ] ] ] ] ] ] ] ] ] ] ] ] MONOPOLY REVENUES & COSTS Revenue Data Cost Data Quantity of Output Price (Average Revenue) Average Total Cost Profit + or loss - Total Revenue Marginal Revenue Total Cost Marginal Cost 0 1 2 3 4 5 6 7 8 9 10 $172 162 152 142 132 122 112 102 92 82 72 $ 0 162 304 426 528 610 672 714 736 738 720 $100 190 270 340 400 470 550 640 750 880 1030 - $100 - 28 + 34 + 86 + 128 + 140 + 122 + 74 - 14 - 142 - 310 90 80 70 60 70 80 90 110 130 150 $162 142 122 102 82 62 42 22 2 - 18 $190.00 135.00 113.33 100.00 94.00 91.67 91.43 93.73 97.78 103.00
] ] ] ] ] ] ] ] ] ] ] ] ] ] ] ] ] ] ] ] MONOPOLY REVENUES & COSTS Revenue Data Cost Data Quantity of Output Price (Average Revenue) Average Total Cost Profit + or loss - Total Revenue Marginal Revenue Total Cost Marginal Cost Can you see profit maximization? 0 1 2 3 4 5 6 7 8 9 10 $172 162 152 142 132 122 112 102 92 82 72 $ 0 162 304 426 528 610 672 714 736 738 720 $100 190 270 340 400 470 550 640 750 880 1030 - $100 - 28 + 34 + 86 + 128 + 140 + 122 + 74 - 14 - 142 - 310 MR > = MC 90 80 70 60 70 80 90 110 130 150 $162 142 122 102 82 62 42 22 2 - 18 $190.00 135.00 113.33 100.00 94.00 91.67 91.43 93.73 97.78 103.00