Satellite Shade Analysis for Improved Photovoltaic Efficiency
10 likes | 149 Vues
This project developed a web application that utilizes Google Maps satellite imagery to conduct quick and accurate shade analyses for potential solar panel installations. By integrating right-angle trigonometry and incorporating real-time data on obstructions, the tool aids solar installers in determining the suitability of roofs for solar energy systems. The current manual shade analysis process is costly and time-consuming; our solution streamlines this step, providing installers with instant estimates, thus enabling more informed customer decisions and potentially increasing sales.

Satellite Shade Analysis for Improved Photovoltaic Efficiency
E N D
Presentation Transcript
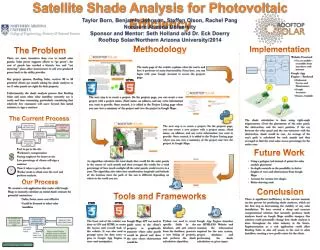
Satellite Shade Analysis for Photovoltaic Efficiency Taylor Born, Benjamin Johnson, Steffen Olson, Rachel Pang Northern Arizona University Sponsor and Mentor: Seth Holland and Dr. Eck Doerry Rooftop Solar/Northern Arizona University/2014 Methodology Implementation The Problem Website Frontend • Use on mobile-- accessible from anywhere with internet Google App Engine – Backend • Dedicated Servers and Maintenance • Google Accounts • Secure, Scalable There are more incentives than ever to install solar panels. Solar power supports efforts to “go green”, the cost of panels has reached a historic low, and "net metering" plans allow homeowners to sell over-produced power back to the utility provider. The main page of the website explains what the tool is and how it performs its main functionality. From here, you can login with your Google Account to access the projects page. Our project sponsor, Rooftop Solar, receives 30 to 40 potential clients per month asking for shade analyses to see if solar panels are right for their property. Unfortunately, the shade analysis process that Rooftop Solar and most other solar installers currently use is costly and time consuming, particularly considering that relatively few customers will move beyond this initial estimate to sign a contract. The next step is to create a project. On the projects page, you can create a new project with a project name, client name, an address, and any extra information you want to provide. Once created, it is added to the Project Listing page where you can view a summary of the project and view the project in Google Maps. The Current Process The shade calculation is done using right-angle trigonometry. Given the placements of the solar panel, the obstruction, and the sun’s position, if the ray between the solar panel and the sun intersects with the obstruction, shade would be cast. An average of the sun’s path is calculated for each month and then averaged to find the total solar access percentage for the entire year. The next step is to create a project. On the projects page, you can create a new project with a project name, client name, an address, and any extra information you want to provide. Once created, it is added to the Project Listing page where you can view a summary of the project and view the project in Google Maps. Future Work Using a polygon tool instead of points for solar module placement In-depth research on the possibility to derive heights of trees and obstructions from Google Maps Account for various tree shapes Better drawing tools An algorithm calculates the total shade that would hit the solar panels in the course of each month and then averages the results for a total percentage of how much sunlight all the solar panels would receive in a year. The algorithm also takes into consideration longitude and latitude of the location since the path of the sun is different depending on where in the world you are. Our Process We created a web application that works with Google Maps to instantly calculate an initial shade estimate for potential contractors. Conclusion Tools and Frameworks • Safer, faster, more cost effective • Could be licensed to other solar installers There is significant inefficiency in the current manual, on-site process for producing shade analyses, which are the first step in determining the viability of any solar installation. We have created a cheap and accurate computational solution that instantly produces shade analyses based on Google Maps satellite imagery. Our solution could potentially change how shade analysis is done throughout the solar industry in the future. Implementation as a web application could allow Rooftop Solar to also sell access to the tool to other installers, creating a new profit center for the client. Fuel to get to the site Workman’s compensation Paying employee for hours at site Low percentage of clients will sign a contract $ Google Maps API was used to guide users to the client’s property to graphically annotate where solar panels would be placed and show the user where obstructions would be. Python was used to create specific fields in the database, add and remove from the database, generate a user listing of projects, and perform the shade calculation algorithm. Google App Engine launches our HTML/CSS Website and contains the information required for the user system, project database, and performing the shade calculation on given input. The front end of the website was done in CSS and HTML to create the layout and overall look of the website. It was also used to prompt users for data entry to pass to Google App Engine to store and manipulate. Time it takes to get to the site Worker needs to climb onto the roof and perform analysis Engineering Design