Download
1 / 77
780 likes | 1.1k Vues
Area IV: Pollution. IVA3: Water Pollution. 20-1 Types, Effects, Sources of Water Pollution. water is polluted by infectious bacteria, inorganic and organic chemicals, and excess heat

E N D
Area IV: Pollution IVA3: Water Pollution
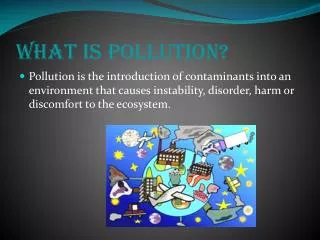
20-1 Types, Effects, Sources of Water Pollution • water is polluted by infectious bacteria, inorganic and organic chemicals, and excess heat • water pollution: any chemical, biological, or physical change in water quality that has a harmful effect on living organisms • the WHO estimates that 3.4 million people/yr people die prematurely from waterborne diseases • an estimated 1.5 million people/yr in U.S. become ill from infectious agents
20-1 Types, Effects, Sources of Water Pollution • scientists monitor water quality by using bacterial counts, chemical analysis, and indicator organisms • number of colonies of fecal coliform bacteria present in a water sample • drinking water: 0 colonies/100 mL • swimming water: < 200 colonies/100 mL • bacterial source tracking (BST) • biological oxygen demand (BOD): the amount of dissolved oxygen consumed by aquatic decomposers
In May 2000 the small community of Walkerton, Ontario was laid waste by a toxic strain of E. coli:0157. • The contamination came from the public water supply. • Six people died in the first week including a two year old daughter of a local medical doctor. • Four new cases surfaced in late July, all very young children. • Over a thousand innocent people were infected. bss.sfsu.edu/ehines/geog600/ Freshwater%20and%20ocean%20Pollution.ppt
Waterborne Bacteria • Disease symptoms usually are explosive emissions from either end of the digestive tract Escherichia coli Vibrio sp. Barbara E. Moore, Ph.D., Department of Biology, University of Texas at San Antonio
Indicator Tests Total coliform [Endo agar] Fecal coliform [m-FC agar] Fecal streptococci [M-enterococcus] Prescott et al., Microbiology Barbara E. Moore, Ph.D., Department of Biology, University of Texas at San Antonio
20-1 Types, Effects, Sources of Water Pollution • scientists monitor water quality, cont. • chemical analysis: inorganic and organic chemicals present, sediment content, and turbidity of water • indicator species • genetic techniques are being used to develop organisms that will glow in the presence of specific pollutants such as toxic heavy metals in the ocean and carcinogens in food
20-1 Types, Effects, Sources of Water Pollution • water pollution can come from a single source or variety of dispersed sources • point sources discharge at specific locations • examples: drainpipes, sewer lines • easy to identify, monitor, and regulate • non-point sources are scattered and diffuse and can’t be traced to any single site of discharge • examples: runoff from croplands, livestock feedlots • difficult and expensive to identify and control these discharges
20-1 Types, Effects, Sources of Water Pollution • sources of water pollution, cont. • leading sources: agriculture, industries, mining • agricultural activities: • erosion • overgrazing • fertilizers • pesticides • excess salt from irrigated soils
20-1 Types, Effects, Sources of Water Pollution • too much rain and too little rain can increase water pollution • increased moisture with more intense rains can flush harmful chemicals, plant nutrients, and microorganisms into waterways • prolonged drought can reduce river flows so there is less dilution available • warmer water contains less dissolved oxygen
Causes of Acid Rain • Sulfur dioxide (SO2) and nitrogen oxides (NOx) are the primary causes of acid rain. • In the US, about 2/3 of all SO2 and 1/4 of all NOx comes from electric power generation that relies on burning fossil fuels like coal.
Buffering Capacity • Acid rain primarily affects sensitive bodies of water, which are located in watersheds whose soils have a limited “buffering capacity” • Lakes and streams become acidic when the water itself and its surrounding soil cannot buffer the acid rain enough to neutralize it • Some lakes now have a pH value of less than 5
Effects on Wildlife • Generally, the young of most species are more sensitive to environmental conditions than adults • At pH 5, most fish eggs cannot hatch • At lower pH levels, some adult fish die • Some acid lakes have no fish
20-2 Pollution of Freshwater Streams • streams can recover from moderate levels of degradable water pollutants if the flows are not reduced • dilution and biodegradation can allow recovery of stream pollution if: • they are not overloaded • do not have reduced flow due to damming, agricultural diversion, or drought
20-2 Pollution of Freshwater Streams • stream recovery, cont. • breakdown of pollutants by bacteria creates an oxygen sag curve • organisms with a high oxygen demand can’t survive in the curve • factors in size of curve: • volume of the stream • volume of wastes entering • flow rate • temperature • pH levels
Investigating BOD Amount of dissolved oxygen needed by aerobic decomposers to break down the organic materials in a given volume of water at a certain temperature over a specified time period Distilled water Pollutant (milk) yeast Color Indicator
Investigating BOD Amount of dissolved oxygen needed by aerobic decomposers to break down the organic materials in a given volume of water at a certain temperature Initial Demonstration Both started Dark Blue- Picture taken after 10 min at 28deg Celcius-(84 F) Test Tube B contains 10ml milk, yeast and methylene Blue Test Tube A the control contains distilled water, yeast and methylene Blue
Initial Demonstration Both started Dark Blue- Picture taken after 20 min at 28deg Celcius-(84 F)
8AM Initial setup with series of dilutions containing degrees of pollutants Level of O2 high-indicated by blue color (BOD)Control 1/16 1/8 ¼ ½ full concentration
After about 1 hr the tubes began to change color. Why are those to the left darker? (BOD) Control 1/16 1/8 ¼ ½ full concentrationm milk
Ultimate results BOD level obvious G Greater the BOD stronger the reattion… More white… the more oxygen present (BOD) Control 1/16 1/8 ¼ ½ full concentration milk
20-2 Pollution of Freshwater Streams • most developed countries have reduced point source pollution, but toxic chemicals and pollution from non-point sources are still problems • the U.S. has avoided increases in pollution from point sources in most streams • cleanup of rivers: Cuyahoga River in Ohio and the Thames River in Great Britain • there are sometimes large fish kills, and contamination of drinking water from industry, mining, and non-point runoff of fertilizers and pesticides
20-2 Pollution of Freshwater Streams • stream pollution in most developing countries is a serious and growing problem • half of the world’s 500 major rivers are heavily polluted • many run through developing countries where waste treatment is minimal or nonexistent
20-2 Pollution of Freshwater Streams • the Ganges River in India is severally polluted • ~350 million people live in the Ganges River basin with little treatment of sewage • Hindu beliefs compound problem • air pollution from cremated bodies • water pollution from bodies thrown in river • government solutions: • waste treatment plants in the 29 large cities along the Ganges • electric crematoriums on its banks • introduction of snapping turtles as body scavengers
20-3 Pollution of Freshwater Lakes • lakes are less effective at diluting pollutants that enter them • often stratified with little vertical mixing • very little flow occurring • may take from 1–100 years to flush and change water in lakes and reservoirs • much more vulnerable to runoff contamination of all kinds of materials • chemical concentrations build up as they pass through the food webs in lakes
20-3 Pollution of Freshwater Lakes • human activities can reduce dissolved oxygen and kill some aquatic species • natural eutrophication: nutrient enrichment of lakes from runoff • depends on composition of the surrounding drainage basin • can enrich abundance of desirable organisms • cultural eutrophication occurs due to runoff • usually near urban or agricultural areas and in coastal water, enclosed estuaries, and bays • can lead to serious pollution problems
20-3 Pollution of Freshwater Lakes • human activities, cont. • cultural eutrophication, cont. • the EPA states that 85% of large lakes near major population centers in U.S. have some amount of cultural eutrophication • can be reduced or prevented by: • banning or limiting phosphates in detergents • advanced treatment methods to remove nitrates and phosphates from wastewater • use of soil conservation to reduce runoff
20-3 Pollution of Freshwater Lakes • human activities, cont. • hot weather or drought -> “blooms” of organisms -> reduction in lake productivity • reduced sunlight + decomposition -> increase in bacteria populations -> decrease in DO -> fish kills -> anaerobic bacteria take over • cleanup of lakes includes removing excess weeds, controlling plant growth, and pumping air through lakes and reservoirs to avoid oxygen depletion • pollution prevention is cheaper than cleanup
20-3 Pollution of Freshwater Lakes • Case Study in lake recovery: Lake Washington, Seattle • sewage diverted from the lake to Puget Sound, where rapid water exchange dilutes sewage • recovery took 4 years • lake had not filled with weeds and sediment • concern about Puget Sound due to increased urban runoff and growing population • What is the best way to deal with pollution?
20-3 Pollution of Freshwater Lakes • Case Study: pollution of the Great Lakes has dropped but is still a problem • the Great Lakes contain about 95% of the fresh surface water in the United States, and 20% of the world’s fresh surface water • > 38 million people obtain drinking water from the lakes • vulnerable due to less than 1% outflow to the St. Lawrence River but lots of inputs • Lake Erie: shallowest; was the most polluted; high concentration of people and industry
20-3 Pollution of Freshwater Lakes • Case Study: Great Lakes pollution, cont. • since 1972, the U.S. and Canada have worked together to reduce pollution • there is still a large area of depleted oxygen that occurs in the center of the lake each August for unknown reasons • a 2000 survey by the EPA stated that more than ¾ of the shoreline is not clean enough for swimming or use as drinking water • non-point land runoff is now a greater problem than industrial pollution
20-3 Pollution of Freshwater Lakes • Case Study: Great Lakes pollution, cont. • biomagnification of the depositions from atmospheric contaminants means that one fish in four is unsafe for human consumption • EPA funding for cleanup has also dropped by 80% since 1992 • environmentalists call for banning the use of bleach, building new incinerators, and stopping the discharge into the lakes of 70 toxic chemicals
20-4 Pollution of Groundwater • groundwater is vulnerable to pollution • spilling gasoline, oil, paint thinners, etc. onto the ground can contaminate groundwater • low-risk ecological problem • high-risk health problem • contaminated water in the aquifer will slowly flow, creating a plume of contaminated water • contaminants in groundwater are not diluted or dispersed because this water moves usually less than 0.3 meter per day
20-4 Pollution of Groundwater • groundwater vulnerability, cont. • cleansing is slow; factors: • lower oxygen content • colder temperature of the water • smaller populations of decomposing bacteria • it can take hundreds of years to cleanse degradable wastes; nondegradable wastes are there permanently
20-4 Pollution of Groundwater • the extent of groundwater contamination is generally unknown • EPA and U.S. Geological Survey figures state that one or more organic chemicals contaminate about 45% of municipal groundwater supplies in the U.S. • ~26,000 industrial waste ponds and lagoons in U.S. do not have a liner to prevent seepage • many underground storage tanks have leaks • determining the extent of a leak is costly, and the cost of cleanup is more costly yet