Food Security Committee
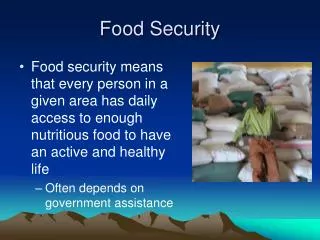
Food Security Committee . State and County Baseline Data May 28, 2009. Food Security. Food Security for a Household: access by all members at all times to enough food for an active, healthy life, including at a minimum: Ready availability of nutritionally adequate and safe foods; &

Food Security Committee
E N D
Presentation Transcript
Food Security Committee State and County Baseline Data May 28, 2009
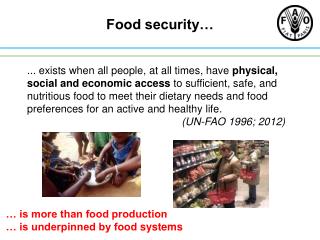
Food Security • Food Security for a Household: access by all members at all times to enough food for an active, healthy life, including at a minimum: • Ready availability of nutritionally adequate and safe foods; & • Assured ability to acquire acceptable foods in reasonably acceptable ways. • Food Insecurity for a Household: limited or uncertain availability of nutritionally adequate and safe foods or limited or uncertain ability to acquire acceptable foods in socially acceptable ways. USDA – Economic Research Service – www.ers.usda.gov/Briefing/FoodSecurity/measurement.htm
Food security status of each household lies somewhere along a continuum divided into four ranges: • High Food Security: no problems/anxiety regarding food; • Marginal Food Security: had problems/anxiety at times, but quality, variety and quantity were not substantially reduced; • Low Food Security:households reduced quality, variety & desirability of diets but quantity of food intake/normal eating patterns not substantially disrupted; & • Very Low Food Security:eating patterns of one or more household members disrupted and food intake reduced because household lacked money/other resources for food. USDA – Economic Research Service – www.ers.usda.gov/Briefing/FoodSecurity/measurement.htm
How Are Food Security & Insecurity Measured? • LEAST SEVERE: Was this statement often, sometimes, or never true for you in the last 12 months? “We worried about whether our food would run out before we got money to buy more.” • SOMEWHAT MORE SEVERE: Was this statement often, sometimes, or never true for you in the last 12 months? “We couldn’t afford to eat balanced meals.” • MIDRANGE SEVERE: In the last 12 months, did you ever cut the size of your meals or skip meals because there wasn’t enough money for food? • MOST SEVERE: In the last 12 months, did you ever not eat for a whole day because there wasn’t enough money for food? In the last 12 months, did any of the children ever not eat for a whole day because there wasn’t enough money for food? USDA – Economic Research Service – www.ers.usda.gov/Briefing/FoodSecurity/measurement.htm
Food Insecurity Household Food Security in the U.S., 2007, Nov. 17, 2008, www.ers.usda.gov
Supplemental Nutrition Assistance Program November 2008 www.okdhs.org
Supplemental Nutrition Assistance Program 5-Year SNAP Participation November 2008 www.okdhs.org
Supplemental Nutrition Assistance Program November 2008 www.okdhs.org
Counties with Over 11% Eligible for SNAP but Not Participating • Payne 24.79% • Cherokee 21.96% • Delaware 16.26% • Custer 16.24% • Texas 15.97% • Le Flore 14.67% • Bryan 14.30% • Pontotoc 12.71% • Lincoln 11.87% • Osage 11.55% • Creek 11.17% Data from U.S. Census Bureau, 2005-2007 American Community Survey 3-Year Estimates. Analysis by the Food and Research Action Center. NOTE: Not all counties have reported their FPL to be included in this slide.
Temporary Aid to Needy Families November 2008 www.okdhs.org
Temporary Aid to Needy Families November 2008 www.okdhs.org
Temporary Aid to Needy Families November 2008 www.okdhs.org
WIC – Women, Infants & Children Oklahoma State Department of Health, CY 2008
WIC – Women, Infants & Children www.ok.gov/health/Child_and_Family_Health/WIC/Caseload_Data/index.html
Percentage Free Student Meals (Below 130% Federal Poverty Level - FPL) Oklahoma State Dept. of Education, Low Income Report for 2008-2009, 2/13/09
Percentage Reduced-Priced Student Meals(Between 130% and 185% FPL) Oklahoma State Dept. of Education, Low Income Report for 2008-2009, 2/13/09
Percentage Low Income Students Oklahoma State Dept. of Education, Low Income Report for 2008-2009, 2/13/09
School Breakfast Program USDA – Food & Nutrition Service Program Data, www.fns.usda.gov/pd/08sbfypart.htm
School Breakfast Program USDA – Food & Nutrition Service Program Data, www.fns.usda.gov/pd/10sbcash.htm
National School Lunch Program USDA – Food & Nutrition Service Program Data, www.fns.usda.gov/pd/01slfypart.htm
National School Lunch Program USDA – Food & Nutrition Service Program Data, www.fns.usda.gov/pd/06slcash.htm
Summer Food Service Program USDA – Food & Nutrition Service Program Data, www.fns.usda.gov/pd/04sffypart.htm
Summer Food Service Program USDA – Food & Nutrition Service Program Data, www.fns.usda.gov/pd/02sfcash.htm
TEFAP: USDA Commodities TEFAP Distribution by County, Feeding America, report execution date: 5/12/2009
TEFAP: USDA Commodities TEFAP Distribution by County, Feeding America, report execution date 5/12/2009
Oklahoma Food Bank Network Pounds through April 30, 2009
Oklahoma Food Bank Network *People reached/week based on 2006 Hunger Study plus Programs reach #Based on monthly average of 2008 Agency Yearly Reporting.
Senior Nutrition Source: Oklahoma Department of Human Services, www.okdhs.org
Unemployment March 2009 U.S. Bureau of Labor Statistics Local Area Unemployment Statistics Information and Analysis
5-Year Unemployment U.S. Bureau of Labor Statistics Local Area Unemployment Statistics Information and Analysis