Download
1 / 1
10 likes | 169 Vues
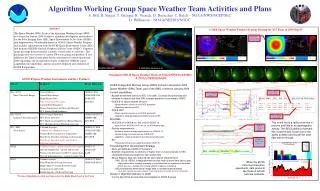
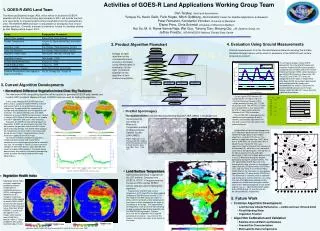
Vegetation Health Index (left) and Smoothed NDVI (right) for Week 26 (June), 2007. 2. Product Algorithm Flowchart. 3. Current Algorithm Developments.

E N D
Vegetation Health Index (left) and Smoothed NDVI (right) for Week 26 (June), 2007. 2. Product Algorithm Flowchart 3.CurrentAlgorithm Developments The left figure displays hourly GOES derived LST from the GOES Surface and Insolation Product (GSIP) full disk product compared with LST observed at the Climate Reference Network (CRN) station located at the USGS EROS facility in Sioux Falls, SD. The GOES and CRN LST values are compared for three days (1-3 April 2004) after those GOES observations determined to be contaminated by clouds were removed from the analysis. Generally the daytime GOES estimates of LST more closely match the CRN LST values than the nighttime observations. • Normalized Difference Vegetation Index/Clear Sky Radiance • The maximum NDVI compositing algorithm will be applied to generate GOES-R daily, weekly and monthly NDVI products. Meteosat-8 and -9 SERIVI data are used for testing the algorithm. Design of each algorithm for the corresponding land product is illustrated using different level of flowcharts. On the right is a sample flowchart for the algorithm of land surface temperature. In this study, Meteosat 8/9 SEVIRI data have been used as a proxy for GOES-R ABI to estimate and monitor NDVI. A set of SEVIRI half-hourly images over Europe and Africa, reprojected to latitude-longitude projection and remapped to 0.04° resolution, has been collected since June 2006. Collection of a set of SEVIRI full-disk images started in January 2007. Both of these datasets are used to test NDVI algorithms and assess their accuracy. Examples of SEVIRI full disk NDVI products for September 9, 2007 are presented on the right. The daily product (a) presents maximum NDVI values observed during the day. The weekly NDVI product (b) incorporates maximum NDVI values observed during the past 7 days. Cloud and ocean masks have been applied to the NDVI maps. To evaluate the NDVI compositing algorithms, temporal profiles of daily and weekly NDVI composite values have been generated for selected test sites. An example in Figure (c) shows seasonal changes of NDVI over Barrax, Spain derived from weekly and daily NDVI products. The graph clearly demonstrates that confirms that weekly compositing allows for better filtering of cloud-contaminated observations. • Fire/Hot Spot Imagery • The modified Wildfire Automated Biomass Burning Algorithm (WF_ABBA) is developed and LST start Initialize variables implemented by University of Wisconsin, Cooperative Institute for Meteorological Satellite Studies (UW-CIMSS). Right: Application of the Prototype ABI WF_ABBA to MODIS Simulated ABI Data in South America.Date: 7-Sep-2004. Time: 17:50 UTC. On the right, ASTER derived LST compared with LST observed at the Climate Reference Network (CRN) station located at Lincoln, NE (11 SW) on 22 Oct. 2003. The ASTER LST data was sampled from a 3 by 3 pixel (270 by 270 m) region centered on the location of the CRN instruments. The ASTER LST is derived from five thermal channels between 8 and 12 microns and includes adjustments for the land surface emissivity within each thermal channel. Read Date/ Time File ABI_[DayTimeID]_T11 ABI_[DayTimeID]_T12 ABI_[DayTimeID]_SAT ABI_[DayTimeID]_SOL ABI_[DayTimeID]_CLD ABI_Emissivity ABI_WaterVapor LST_Coeffs ABI_Geometry Initialize Input File List Contour plots of land surface temperature (LST) difference observed from GOES-8 and GOES-10 Imager data. A split window algorithm is used for LST retrieval. The contour is made from one-year (2001) data over a SURFRAD site (Desert Rock, NV) at 36.630 N and 116.020 W. The x-axis represents month of the year from January (J) to December (D), while the y-axis represents solar time of the observations. The red lines in the figure separate the day and night observations. Note that a dipole pattern exists in the LST difference during the daytime, particularly during the summer months. The LST observed by GOES-East (-8) in the morning hours after sunrise is a few degrees larger than the LST observed by GOES-West (-10); and vice versa, the LST observed by GOES-West in the afternoon is a few degrees larger than the LST observed by GOES-East. This difference is relatively small at nighttime and during winter months when the sun is low. The sign of the difference depends on the relative sun-satellite azimuth angles and the value of this difference depends on the zenith angle of the sun. Note that the zenith angles of the GOES-8 and -10 over the site are 60.140 and 46.810, respectively. Read Each File Set (a) Daily composite (09/09/2007) (b) Weekly composite (09/09/2007) Process data on a pixel basis Cloud Free YES WaterVapor ≤ 2.0 Sol_Zen ≥ 85° NO YES NO WaterVapor ≤ 2.0 YES NO NO YES Coefficients for Wet Night Coefficients for Dry Day Coefficients for Wet Day Coefficients for Dry Night CIMSS ABI WF_ABBA Fire Mask Product CIMSS MODIS Simulation of ABI 3.9 micron band LST Calculation (c) Daily and Weekly NDVI profiles for Barrax, Spain WaterVapor ≤ 5.0 NO • Land Surface Temperature • Split window technique is applied for the LST retrieval. Datasets from GOES-8, GOES-10 Imagers and the European MSG satellite SERIVI sensor data are used for testing the algorithm. • A preliminary GOES-R land surface temperature (LST) algorithm has been applied to Meteosat SEVIRI data to retrieve LST. In the image on the left, clouds are shown in white, and the retrieved surface temperatures are shown in colors according to the scale at the bottom of the image. This experimental LST algorithm is one of several that are being studied as potential operational algorithms for the GOES-R ABI instrument. Surface emissivity for this algorithm was assigned according to land cover. Local time for this image is near local solar noon at the center of the image. YES QC Record Write: ABI_[DayTimeID]LST ABI_LST_QCFlag Vegetation Health Index estimates vegetation condition based on combination of vegetation greenness (NDVI) and brightness temperature (BT). Temporal smoothing technique will be applied on weekly NDVI and BT to minimize the impact of cloud and high frequency noise. Data from NOAA AVHRR is used to test the algorithm. The images were created from NOAA GVI-x dataset, which is 7 days composite with spatial resolution about 16 km . End LST Activities of GOES-R Land Applications Working Group Team 1. GOES-R AWG Land Team The Advanced Baseline Imager (ABI), which will be on board the GOES-R satellites with the first launch being approximately in 2014, will provide the best-ever opportunity for measuring land surface parameters from the geostationary orbit. The GOES-R AWG land team is responsible for developing most of land surface products . Currently, the team is chaired by Yunyue Yu, and was chaired by Dan Tarpley before August, 2007. Dan Tarpley, Short and Associations Yunyue Yu, Kevin Gallo, Felix Kogan, Mitch Goldberg, NOAA/NESDIS Center for Satellite Applications & Research Peter Romanov, Konstantin Vinnikov, University of Maryland Elaine Prins, Chris Schmidt, University of Wisconsin-Madison Hui Xu, M. K. Rama Varma Raja, Wei Guo, Yuhong Tian, Shuang Qiu, I.M. Systems Group, Inc Jeffrey Privette, NOAA/NESDIS National Climatic Data Center 4. Evaluation Using Ground Measurements Ground measurements from the Climate Reference Network including the Surface Radiation Budget Stations will be used for evaluation of the GOES-R land surface temperature product. • Vegetation Health Index • 5. Future Work • Continue Algorithm Development • Land Surface Albedo/Reflectance ---visible and near infrared band • Flood/Standing Water • Vegetation Fraction • Algorithm Calibration and Validation • Satellite-Ground Match-up Database • Ground Site Characterization • Multi-satellite Data Comparisons