Download
1 / 32
320 likes | 450 Vues
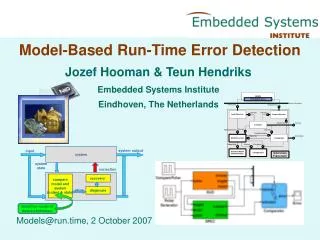
Model-based detection of event-related signals in electrocorticogram. Jeffrey A. Fessler, Se Young Chun EECS Department Jane E. Huggins, Simon. P. Levine Dept. of Physical Medicine and Rehab., and Biomedical Engineering. The University of Michigan, Ann Arbor, MI.

E N D
Model-based detection of event-related signals in electrocorticogram Jeffrey A. Fessler, Se Young Chun EECS Department Jane E. Huggins, Simon. P. Levine Dept. of Physical Medicine and Rehab., and Biomedical Engineering The University of Michigan, Ann Arbor, MI NIPS BCI Workshop, 2004-12-17
UM-DBI Project The University of Michigan Direct Brain Interface (UM-DBI) project seeks to detect voluntarily produced electrocortical activity (ECoG) related to actual or imagined movements in humans as the basis for a DBI.
Signal Source • Subdural implantation • Location selected for epilepsy monitoring, not necessarily on motor cortex • Macro electrodes • 4 mm diameter • 1 cm center-to-center • Grids and/or strips • 4 - 126 electrodes
ECoG Data • Subjects perform about 50 repetitions of up to 6 different (real) voluntary actions. • Events (unprompted) separated by 3 to 10 seconds • Action marked by EMG signal (partial labeling). • No feedback or training. • 10,000+ ECoG traces (not all useful)
Initial Detection Method • Data: sampled ECoG signals from a single electrode • Detection of event-related potentials (ERPs): • Cross-correlate ECoG signal with a signal template • Template: triggered average of training data • Compare output to an empirical threshold • Cross-Correlation based Template Matching (CCTM)
ERP Template Example ECoG signals from 5 events Average of 23 events (ERP template)
Cross Correlation Method: Its Implicit Model • Two hypotheses for an ECoG signal block x: • H0 : x ~ N(0, 2 I) “rest” • H1 : x ~ N(, 2 I) “task/event” where denotes the template signal vector • Neyman-Pearson optimal detector, under the above model, formed from the likelihood ratio, is x’ which is cross correlation (CCTM). • But the “white noise” signal model ignores changes in the signal power spectrum!
Power Spectrum Changes • The ECoG signal spectrum changes during tasks. • Event-related desynchronization (ERD) and event-related synchronization (ERS) • (ERD/ERS maps from B. Graimann et al, Graz)
Averages ERD/ ERS Concurrence of ERP and Spectral Changes
Moving-window spectra • Time “0” is the event trigger times. • The power spectrum changes significantly near event onset.
Power Spectrum Changes • Short-time power spectrum minus baseline power spectrum
Moving-window Spectra(Individual events) • Spectral changes are evident even in single events!
Spectrum-BasedDetection Strategies • Feature based: • Extract spectral signal features e.g., band power, adaptive AR methods (Graz) • Apply feature-based detection (e.g., LDA) • Model based: • Develop “optimal” detector based on signal models that attempt to capture key signal characteristics.
Quadratic Detector based on Two-Covariance Signal Model • Two hypotheses for the ECoG signal (block) x: • H0 : x ~ N(0, K0) “rest” • H1 : x ~ N(, K1) “task/event” where Kn denotes the covariances in each state • Neyman-Pearson optimal detector, formed from the likelihood ratio, is: x’ (K0-1 - K1-1) x which is a quadratic detector (cf Mahalanobis distance). • (For now, ignore the ERP component
Challenges / Solutions • Large covariance matrices => many model parameters? • Solution: AR spectrum model (about 6th order) • AR models (non-adaptive) for K0 and K1 estimated from training data. • Unprompted events => incompletely labeled data. • Solution: joint maximum-likelihood (ML) estimates of labels and AR coefficients from training data. • Inversion of large covariance matrices? • Solution: simple FIR filters due to AR model.
Quadratic DetectorBlock Diagram • Two FIR filters (AR inverse) • Moving sum-of-squares (innovation power) • Normalize by ML estimates of variances • Compare “which model fits better” • Neyman-Pearson => most powerful (per block)
Feature-based vs Model-based • Spectra of simulated signals: H0 H1
ROC from Simulation Quadratic Band-power AAR / LDA
Test Data & Results • Representative subset of 20 data sets from 10 subjects • 2184 ECoG channels • Evaluate in terms of “HF difference” • % of “hits” (a detection within an acceptancewindow) minus % of false detections. • ROC evaluation seems infeasible due to unprompted actions / incompletely labeled data.
Quadratic vs CCTM: 0.5 sec Delay ECoG channels above each HF-difference threshold
Detection Delay • Important for feedback!
Summary • Quadratic detector • Based on two-covariance model. • Captures spectral changes. • Simple real-time implementation. • Improved detection accuracy over CCTM. • Reduced detection delay. • Recently implemented in our real-time system. • Feedback studies with imagined movements forthcoming.
Future work • Combine two-covariance model with ERP component? • Three-covariance model? (ERD / ERS / rest) • Time-varying / adaptive models • state space / hidden Markov • in collaboration with Victor Solo • Extend to multi-channel detection methods • Integrate into real-time use for feedback studies • Imagined movements (in progress)
Triggered ECoG Averages Average ECoG from 32 electrode locations during pinch
CCTM Detection • Cross-correlate ERP template and ECoG • Detection: Correlation value exceeds an empirical threshold • Hit: Detection between 1.0 sec before and 0.25 sec after a trigger • Results quantified by Hit% - False Positive% (HF-difference) Template Continuous ECoG Cross-Correlogram
Single Channel Detection Hit % and False % for best channel in each data set (Average method, top 50 data sets for 18 subjects)
ML Estimates of Labels • Estimate center and width of “task” intervals using log-likelihood under two-covariance model. • (Requires search over center / width.)
ML labels vs MSE labels • Joint ML approach to labeling data yielded comparable performance to previous heuristic MSE approach.
Detection Delay • (not sure about this data from JV)
Moving-window spectra • Time “0” is the event trigger times. • Clearly the power spectrum changes near event onset. • (Visible even in single event moving-window spectra.)