Download
1 / 14
140 likes | 330 Vues
Comparison of the electron density profiles measured with the Incoherent Scatter Radar, Digisonde DPS-4 and Chirp-Ionosonde. Ratovsky K.G., Shpynev* B.G., Kim A.G., Potekhin A.P., Medvedev A.V. and Petko P.V Institute of Solar-Terrestrial Physics, 664033, P.O.Box 4026, Irkutsk, Russia

E N D
Comparison of the electron density profiles measured with the Incoherent Scatter Radar, Digisonde DPS-4 and Chirp-Ionosonde Ratovsky K.G., Shpynev* B.G., Kim A.G., Potekhin A.P., Medvedev A.V. and Petko P.V Institute of Solar-Terrestrial Physics, 664033, P.O.Box 4026, Irkutsk, Russia E-mail: ratovsky@iszf.irk.ru
Irkutsk ground-based radio instrument networkincludes : The Irkutsk incoherent scatter (IS) radar (53°N, 103.3°E) used to measure electron densities, electron and ion temperatures, and plasma drift velocities. The multi-position chirp-ionosonde (FMCW sounder) for investigating the ionosphere using the methods of vertical, oblique-incidence and backscatter sounding includes 1 receiving station at Tory (51.7°, 103.8°) and 3 transmitting stations located at Norilsk (69°N, 88°E), Magadan (60°N, 150.7°E), and near the IS radar. Continuous observations of the ionosphere are made with the Digisonde (DPS-4 sounder) at Irkutsk (52°N, 104°E).
Chirp-sounder or FMCW ionosonde( ionosonde with linear frequency modulation )
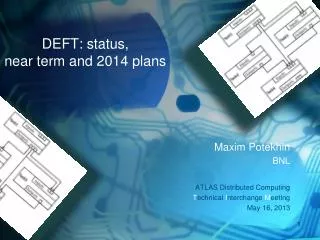
The locations of the instruments FMCW radio path Ground projections of ISR beam at various heights ISR beam inclination is 16 from a vertical
INTRODUCTION • The electron density measurements with the three closely spaced radio technical instruments enable us both to perform mutual calibration of the instruments and to explore the capabilities which cannot be realized with each of the instruments by itself. • The distinctive property of the Irkutsk ISR implies that the electron density profile is measured by the Faraday rotation method and hence ISR has no need of calibration by ionosonde. • The comparison technique consisted in separate comparison of slowNe(z,t) and fast Ne(z,t) electron density variations. The separation of variations into slow and fast ones was carried out by the filtering. The filter band was chosen so that the slow variations represented fluctuations with the periods T > 4h., and fast variations were fluctuations in a range of the periods 1h. < T < 4h. The comparison of slow variations has been performed for revealing the discrepancies in diurnal variations of the electron density. The comparison of fast variations has been conducted in an effort to extract an additional information about traveling ionospheric disturbances. Further we shall assume that functionNedescribes regular variations of the electron density and Ne corresponds to disturbances. • All ionogram data have been manually scaled with the interactive ionogram scaling technology SAO-Explorer. The profiles were reconstructed using the Reinisch and Huang (1983) method with the extrapolation above a peak height by the Reinisch and Huang (2001) method .
The comparisons of regular electron density variations have revealed two main types of discrepancies. • With the strong Ne gradients in the morning hours the DPS-4 overestimate the ISR density. The strong spatial electron density gradients deflect the HF radiowave path from the vertical in the direction of increasing density, as a result the ionosonde receives echoes from the east regions and gives the overestimated Ne values. • In the daytime the ISR overestimate the DPS-4 density at heights below and above the peak height, i.e. ISR produces thicker profile. The distinction may be connected with several reasons. Because of he finite pulse duration and large horizontal beam size along with a beam inclination the ISR produces the height-averaged profile. On the other hand the absence of ionogram traces at low frequencies because of absorption or blanketing by Es-layer may cause the ionosonde profile thickness to decrease. • At the moment it is not clear what instrument distorts the profile to a greater extent.
The regular electron density variations observable by the Chirp-Ionosonde are closer to the DPS-4 than to the ISR data. Chirp-ionosonde – ISR discrepancies replicate the main features of DPS-4 – ISR discrepancies: • the ionosondes overestimate the ISR density in the morning hours. • the ISR produces thicker bottomside profile. • DPS-4 produces thicker profile over the Chirp-ionosonde. It is concerned with distinction between vertical and weakly-oblique sounding.
The electron density disturbances obtained by the ISR and DPS we separated into two types: correlated and uncorrelated ones. From 0 to 5 UT there is no correlation between the ISR and DPS-4 disturbances. At this time the DPS-4 recorded complex ionograms with oblique or spread echo traces. The good correlation between the disturbances is seen from ~ 6 UT, when the ISR and DPS-4 data are about the same fluctuations shifted in time. At this time the DPS-4 recorded the relatively simple ionograms.
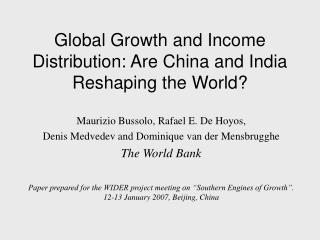
Here is an example of a complex ionogram with double o- and x-traces and three versions of Ne-profiles: ISR profile, DPS profile reconstructed from right trace and DPS profile reconstructed from left trace . None of the DPS profiles is coincident with ISR version. Most likely the uncorrelated disturbances are due to intensive ionospheric irregularities of scales less than or equal to 100 km. The difficulties in measuring disturbance characteristics are primarily associated with the difficulties in interpreting complex ionograms in the presence of oblique or spread echo traces.
More often we observe correlated disturbances Correlated disturbances are due to ionospheric irregularities of scales considerably greater then 100 km, and to the traveling ionospheric disturbances caused by acoustic-gravity waves in particular. Accordingly the observation of such disturbances by the various instruments can be used for measuring disturbance characteristics, like the velocity and motion direction.
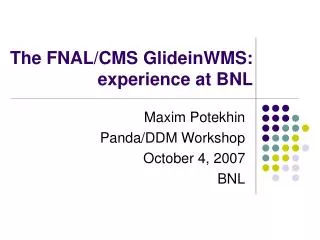
During the main phase of the strong magnetic storm on November 10, 2004 we observed from 6:45 UT the strong positive electron density disturbance. Both instruments show some identical disturbance properties, such as the duration, the peak time and increase of disturbance amplitude with height. All this assigns the disturbance to the correlated type. The main discrepancy between the disturbances consists in higher disturbance amplitude observed by the ISR. Probably this discrepancy is connected with the fact that the DPS-4 ionogram height range was limited by 730 km. One can see from Fig. 4 that the disturbance shape noticeably varies with the height, suggesting that there is an interference of two disturbances.
Summary • The electron density measurements with the three closely spaced radio technical instruments allowed us to reveal the listed below types of discrepancies. • With the strong electron density gradients in the morning hours the ionosondes give the overestimated electron density values in comparison with the ISR. • The ISR produces thicker profile in comparison with the ionosonde data. • The electron density disturbances obtained by the different instruments may have a correlated and uncorrelated nature. The observation of uncorrelated disturbances is accompanied by recording of complex ionograms. The difficulties in measuring disturbance characteristics are primarily associated with the difficulties in interpreting ionograms. • More often we observe correlated disturbances The observation of the correlated disturbances by the various instruments can be used for measuring the disturbance velocity and motion direction.