Download

1 / 41
410 likes | 537 Vues
A nalyzing F inancial P erformance A tlas B attery P vt L imited. P resented b y. K huram S hahzad 0 83268 S ajid S iddique 0 81113 N aveed H assan 0 83106 S alman R asheed 0 82119 F aran M ajeed 0 83114 U mar J aved 0 81158. A nalyzing F inancial P erformance.

E N D
Analyzing Financial Performance Atlas Battery Pvt Limited
Presented by Khuram Shahzad 083268 Sajid Siddique 081113 Naveed Hassan083106 Salman Rasheed 082119 Faran Majeed 083114 Umar Javed 081158
Analyzing Financial Performance Financial ratios du pont analysis standardized financial statements Applications of financial analysis Problems in using FSA SUMMARY
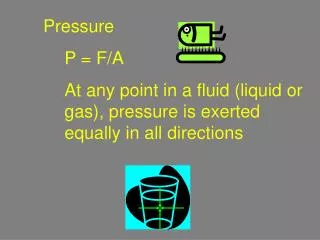
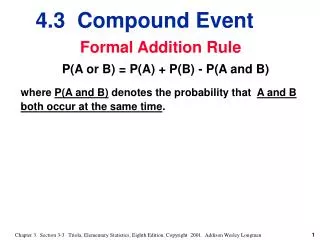
Analyzing Financial Performance Financial ratios Ratiois an arithmetic relationship between two figures FRA is a study of ratios between various items in fin statements
Interpretation Is drawing conclusions to serve as basis for decisions and actions
Analyzing Financial Performance Financial Ratios- Classification • Liquidity • Leverage • Turnover • Profitability • Valuation
Atlas Battery:P/L Account for the year ending 31st March, 20x9 (Rs in Mil) 20x9 20x8 Net Sales 3157 2628 COGS 2626 2242 Stocks 421 370 wages & salaries 68 55 other Mfg Exp 63 50 Gross Profit 530 387 Operating Expenses 60 49 Distributin 124 115 Gn Adm 71 56 Op Expenses 21 12 Other Op Income 2.2 1.9 Operating Profit 316 206 Non Operating surplus/deficit -- -- Interest 44 42 Profit before tax 273 164 Tax 95 57 Profit after tax 178 1 07 Per Share Data (Rs) EPS 25.41 15.27 Mkt Price Per Share 171.81 167.8 Book Value per share 76.016 58.106
Atlas Battery: Balance Sheet as on 31st March,20x9 (Rs in Mill) 20x9 20x8 I Equity and Liabilities 1 Share Capital & Reserve 532 406 a) Share Capital 70 70 b) Reserves & Surplus 462 336 3 Surples on Revaluation 174 174 2 Liabilities 598 627 a) Non Current 86 62 Deffered Liabilities 86 62 b) Current 509 565 Trade & Other Payables 331 192 Short Term Borrowings 104 313 Provision For Taxation 77 59 1300 1207 • Current Assets • Loans & Advances • Current Liabilities • Provisions
Atlas Battery: Balance Sheet as on 31st March,20x9 (Rs in Mill) 20x9 20x8 I Assets 1 Fixed Assets 635 518 2 Long term Deposits 2 4 3 Current Assets 662 685 Inventories 435 411 debtors 116 165 Cash & Bank Balance 29 49 Loans & Advances 2 1 Othe Receivables 81 59 1300 1207 • Current Assets • Loans & Advances • Current Liabilities • Provisions
Liquidity Ratios 662/509 =1.31 Current Assets Current Liabilities Current Ratio = (662-435)/509 =0.447 Current Assets-inventory Current Liabilities Acid Test Ratio = 662 - 509 =153.22 Working Capital Current Assets – Current Liabilities =
Leverage Ratios (Refers to use of debt finance)
Leverage Ratios Debt Equity 435 / 532 =0.817 =81.77% Debt Equity Ratio = Financial Leverage Refers to Use of Debt Finance Debt Assets Debt Asset Ratio 435 /1300 = 0.334 = 33.43% = 316/43.5 = 7.268 = Profit before Int and Taxes Interest Interest Coverage Ratio
Turnover Ratios (Measure how efficiently assets are employed)
Inventory Turnover Cost of Goods Sold Average Inventory 2627/423 =6.22 Turnover Ratios activity Ratios how assets are employed Debtors’ Turnover Net Credit Sales Average Sundry Debtors 3157/80.74 =39.09 Average Collection Period Average Sundry Debtors Av. Daily Credit Sales 80.74 (3157/365) =9.34 days 365 39.09 =9.34 days 365 Debtors’ Turnover
Fixed Assets Turnover 3157/85.627 =36.867 Net Sales Av. Net fixed assets Turnover Ratios Activity Ratios How Assets Are Employed Total Assets Turnover Net Sales Average Total Assets 3157/1300.156 =2.428
Profitability Ratios Profit Margin Ratios Rate of Return Ratios
Gross Profit Margin Ratio • Net Profit Margin Ratio • Return on Assets • Earning Power • ROCE • Return on Equity
GP Margin Ratio Gross Profit Net Sales 530/3157 =16.79% Profitability Margin Ratios NP Margin Ratio Net Profit Net Sales 178/3157 =5.63%
Return on Assets Profit after Tax Av. Total Assets 178/1300.156 =13.7% Earning Power EBIT Av. total Assets 316/1300.56 =24.34% Profitability Return Ratios PBIT(1-Tax Rate) Av.total Assets ROCE 316(1-0.5)/1300.56 =12.15% Return on Equity Equity Earnings Av. Equity 178/531.54 =33.4%
Valuation Ratios (How Equity Stock is assessed in Capital Market)
Price Earning Ratio Market Price Per Share Earning per Share 171.81/25.41 =6.76 Market Value to Book Value Ratio Market Price Per Share Book Value per Share 171.81/76.02 =2.26 Valuation Ratios Book Value Per Share Common Stock Equity Outstanding Shares 532/6992579 =76.016
Comparison with Industry • Time Series of Financial Ratios
Comparison of Ratios of Atlas Battery with Industry Average Ratio Atlas Ltd Industry Av. Liquidity Current Ratio 1.31 1.26 Acid Test Ratio 0.44 0.40 Leverage Debt Equity ratio 0.81 1.15 Debt Ratio 0.34 0.46 Interest Coverage Ratio 7.2 5.14 Turnover Inventory turnover 6.22 6.43 Acct Receivable TO 38.1 24.06 FA Turnover 5.0 5.79 Total Assets Turnover 2.4 1.96 Profitability GP Margin Ratio 16.8% 18.0% NP Margin Ratio 13.7% 11.0% Return on Assets 7.7% 6.9% Earning power 20.0% 17.7% ROCE 40% 31.96% Return on Equity 33.4% 22.03% Comparison
Times Series of Certain Ratios 1 2 3 4 5 Debt-Equity ratio 0.84 1.08 1.25 1.13 1.16 Total Assets turnover 2.4 2.2 2.1 2.1 1.9 Net P margin(%) 5.6 4.1 5.5 3.4 4.3 Return on Equity(%) 33.4 26.3 26.0 15.6 17.4 Earning Power 5.7 10.1 11.7 9.5 8.7 Time Series
Profile of Profitability of a Firm (DU PONT ANALYSIS) Overall Profitability depends upon 2 elements • Profit Margin • On Sales • Selling Price • Cost and • Expenses • Turnover of Firm • Total Assets • Sales Du pont added another Dimension to it
Analyzing Financial Performance du pont analysis • Du Pont Company pioneered this system of FA • Analyze Return on Assets • With the help of Net Profit Margin (NPM) & • Total Assets Turnover Ratio (TATR) • Extended to get Return on Equity (ROE)
Analyzing Financial Performance ROA Net Profit Net Sales Net Sales Av.Total Assets x du pont analysis NPM TATR ROE Net Profit Net Sales x Net Sales Av.Total Assets Av. Total Assets Av Equity x NPM TATR EFR
Analyzing Financial Performance ROA 178 3157 3157 1300 x Net Profit Net Sales Net Sales Av.Total Assets x du pont analysis =13.69% NPM TATR 13.69 x 2.44 = 33.45 % ROE Net Sales Av.Total Assets Net Profit Net Sales x Av. Total Assets Av Equity x
Analyzing Financial Performance 178 3157 3157 1300 1300532 x X du pont analysis 5.6 X2.42 X 2.44 = 33.45 How these results can be improved?
Common-Size Statements standardized financial statements
Common-Size Statements Net sales is usually the base and is expressed as 100%.
2009 Cost ÷ 2009 Sales × 100% ( Rs 2,626,740 ÷ Rs3,156,807 ) × 100% = 83.2% Common-Size Statements 2008 Cost ÷ 2008 Sales × 100% ( Rs2,241,937 ÷ Rs2,628,820 ) × 100% = 85.3%
Analyzing Financial Performance Applications of financial analysis • Assessing Corporate Excellence • Judging Creditworthiness • 4c’s-character,capital,capacity,collatral • Forecasting Bankruptcy • Valuing Equity Shares • Estimating Market Risk • Indicators of Corporate • Excellence (IDBI) • Growth rate of Sales • Growth rate of Assets • PBT to C Employed • WC to Gross Sales • Debt Equity Ratio
Analyzing Financial Performance Using financial statement analysis • Price Level Changes • Variations in Accounting Policies • Window Dressing • Interpretation of Results • Correlation among Results Problems
SUMMARY Analyzing Financial Performance Comparative Analysis
SUMMARY (Cont’d) • Sales increasd from 2628.83 mil to 3156.81 mil. • Net income raised from 106.79 mil to 177.68 mil. • Cash and Cash equilents have decrased down to 28.89 mil. • Basic earning per share increased from Rs. 15.27 to • Rs. 25.41 per share • Overall Performance has been better as Compared to • Previous Year Analyzing Financial Performance Comparative Analysis