Download
1 / 15
150 likes | 274 Vues
This document presents findings from the SMP meeting at Woods Hole in July 2001, focusing on the examination of particulate organic carbon (POC) relationships based on global transmissometer data. Analysis includes datasets from the North Atlantic Bloom Experiment (NABE), Bermuda Atlantic Time Series (BATS), and Hawaii Ocean Time-series. Critical assessments of POC and beam attenuation relationships are explored, providing insights on POC distribution across various depths in both the Atlantic and Pacific Oceans, contributing to our understanding of marine productivity and biogeochemical cycles.

E N D
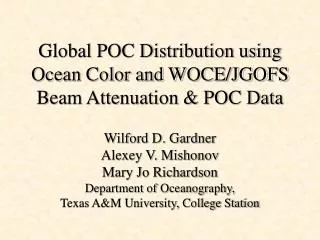
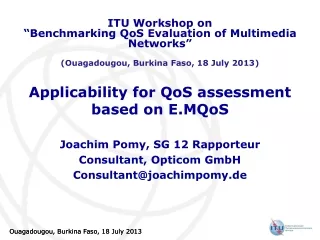
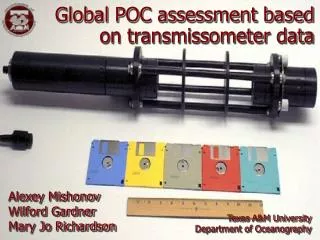
Global POC assessment based on transmissometer data Alexey Mishonov Wilford Gardner Mary Jo Richardson Texas A&M University Department of Oceanography
WOCE POC JGOFS Other Global Transmissometer & POC Data Coverage SMP meeting, Woods Hole, July 2001
Global Transmissometer database on the web: http://www-ocean.tamu.edu/~pdgroup/DataDir/SMP-data.html SMP meeting, Woods Hole, July 2001
Beam C - POC relationship: Data Used • North Atlantic Bloom Experiment (NABE) Data • Sampling Period: Apr-May 1989 • 21 stations/casts • Sampling depth: from 2 to 3200 m • 165 data pairs • Bermuda Atlantic Time Series (BATS) Data • sampling period: 1990-1997 • 62 cruises/stations/casts • Sampling depth: from 0.6 to 1000 m • 608 data pairs Atlantic Ocean SMP meeting, Woods Hole, July 2001
Beam Cp, m-1 Beam Cp, m-1 BATS: Beam Cp - POC relationship Winter Summer POC, mg m-3 Autumn Spring POC, mg m-3 Atlantic Ocean SMP meeting, Woods Hole, July 2001
773 data pairs 300 BATS NABE Regression 250 200 POC, mg m-3 150 100 POC=BeamCp*311.5547+0.299 50 R=0.941 0 0 0.2 0.4 0.6 0.8 1 Beam Cp, m-1 NABE & BATS: Beam Cp - POC relationship Atlantic Ocean SMP meeting, Woods Hole, July 2001
0 Hawaii Time Series data: 200 POC vs Beam Cp (n=476) 100 0-100m 100-300m >300m 400 90 80 70 600 60 POC, mg m-3 50 800 40 30 1000 20 10 1200 0 0 0.2 0.4 0.6 0.8 1 Beam Cp, m-1 Beam Cp - POC relationship: Data Used • Hawaii Ocean Time-series: 1991-1995 • 37 cruises / stations / casts • 487 data pairs • Depth: 2.5 - 1050m Pacific Ocean SMP meeting, Woods Hole, July 2001
0 200 Beam Cp vs POC 100 34.087x y = 7.0624e y = 545.64x + 5.667 90 2 2 R = 0.7352 R = 0.5618 80 70 400 POC, mg m-3 60 50 40 30 600 20 10 0 0 0.02 0.04 0.06 0.08 0.1 Beam Cp, m-1 Beam Cp - POC relationship: HOT Pacific Ocean SMP meeting, Woods Hole, July 2001
S.A.V.E.: POC spatial distribution Atlantic Ocean SMP meeting, Woods Hole, July 2001
CZCS Data from Beam C & CZCS chl: S.A.V.E. data Atlantic Ocean SMP meeting, Woods Hole, July 2001
Density POC, mg/m3 calculated 40°N 35°N -75°W -70°W -65°W -75°W -70°W -65°W 0 20 40 60 80 100 120 140 160 23.4 23.8 24.2 24.6 25 25.4 25.8 26.2 Temperature Salinity 40°N 35°N 2 4 6 8 10 12 14 16 18 20 22 24 26 32 32.6 33.2 33.8 34.4 35 35.6 36.2 WBEX-1: POC spatial distributionApril-May, 1986: mixed layer average (upper 30 m) Atlantic Ocean SMP meeting, Woods Hole, July 2001
45°N POC, mg m-3 Density calculated 40°N 35°N -70°W -65°W -60°W -55°W -70°W -65°W -60°W -55°W 23.4 23.8 24.2 24.6 25 25.4 25.8 26.2 0 10 20 30 40 50 60 70 80 90 100 120 140 45°N Temperature Salinity 40°N 35°N 2 4 6 8 10 12 14 16 18 20 22 24 26 32 32.8 33.6 34.4 35.2 36 36.4 Oceanus-134: POC spatial distributionJune-July 1983: mixed layer average (upper 30 m) Atlantic Ocean SMP meeting, Woods Hole, July 2001
WOCE POC JGOFS Other Global Transmissometer & POC Data Coverage SMP meeting, Woods Hole, July 2001
FSU WOCE NABE BATS HOT JGOFS FSU Other Beam c & POC coverage + some FSU Beam c & POS data for Atlantic Beam C POC SMP meeting, Woods Hole, July 2001
Thank You SMP meeting, Woods Hole, July 2001