Coding Multiple Category Variables for Inclusion in Multiple Regression
Coding Multiple Category Variables for Inclusion in Multiple Regression. More kinds of predictors for our multiple regression models Some review of interpreting binary variables Coding Binary variables Dummy coding Effect Coding Interpreting b weights of binary coded variables

Coding Multiple Category Variables for Inclusion in Multiple Regression
E N D
Presentation Transcript
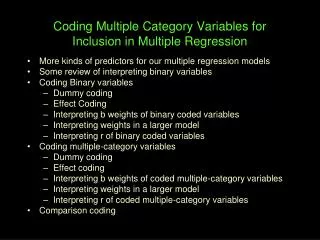
Coding Multiple Category Variables for Inclusion in Multiple Regression • More kinds of predictors for our multiple regression models • Some review of interpreting binary variables • Coding Binary variables • Dummy coding • Effect Coding • Interpreting b weights of binary coded variables • Interpreting weights in a larger model • Interpreting r of binary coded variables • Coding multiple-category variables • Dummy coding • Effect coding • Interpreting b weights of coded multiple-category variables • Interpreting weights in a larger model • Interpreting r of coded multiple-category variables • Comparison coding
Up until now we have limited the kinds of predictor variables in our models to quantitative and binary (usually coded 1 & 2). In this section we will add several new variable types to our repertoire… dummy & effect codes for binary qualitative variables -- different coding strategies allow us to test specific RH: dummy, effect & comparison coding for k-category variables -- lots of categorical or qualitative variables aren’t binary -- k-group variables can be important predictors – we have to be able to accommodate them in MR models -- different coding strategies allow us to test specific RH: The idea is NOT to replace ANOVA with MR, but to be able to incorporate any variable type into multiple regression models !!
Non-linear relationships -- not all the interesting relationships are “linear” or “just linear” ≠ r = 0.0 for both no linear relationship. But the plot on the left shows a strong relationship – just not a linear relationship Each has a “linear component“ ≠ ≠ But not the “same shape of relationship”
2-way interactions - any mix of binary, k-group & quant predictor vars Drugs expert depression % correct Talk novice Control practice # sessions 3-way interactions - any mix of binary, k-group & quant predictor vars expert novice % correct unpaid paid practice non-linear interactions – you can miss interactions if only look for linear interactions Drugs expert depression % correct Talk novice Control # sessions practice
Things we’ve learned so far … • for interpreting multivariate b from quantitative & binary predictor variables in models • both can be interpreted as “expected change in y for a 1-unit change in the predictor” • both interpretations need to include the statement “when controlling for all other variables in the model” • with binary variables we are more likely to use language about the direction and size of criterion variable mean difference between the binary groups, after controlling for all other variables in the model
Review of interpreting unit-coded (1 vs. 2) binary predictors… Correlation r -- tells direction & strength of the predictor-criterion relationship -- tells which coded group has the larger mean criterion scores (significance test of r is test of mean difference) Bivariate Regression b -- tells size & direction mean difference between the groups (t-test of b is significance test of mean differences) a-- the expected value of y if x = 0 which can’t happen – since the binary variable is coded 1-2 !! Multivariate Regression b -- tells size & direction of mean difference between the groups, holding all other variables constant (controlling for) (t-test of b is test of group mean difference beyond that accounted for by other predictors -- ANCOVA) a-- the expected value of y if value of all predictors = 0 which can’t happen – since the binary variable is coded 1-2 !!
Coding & Transforming predictors for MR models • Categorical predictors will be converted to dummy codes • comparison/control group coded 0 • @ other group a “target group” of one dummy code, coded 1 • Quantitative predictors will be centered, usually to the mean • centered = score – mean • so, mean = 0 Why? Mathematically – 0s (as control group & mean) simplify the math & minimize collinearity complications Interpretively – the “controlling for” included in multiple regression weight interpretations is really “controlling for all other variables in the model at the value 0” – “0” as the comparison group & mean will make b interpretations simpler and more meaningful
Dummy Coding for two-category variables • need 1 code (since there is 1 BG df) • comparison or control condition/group gets coded “0” • the treatment or target group gets coded “1” For several participants... Case group dc 1 1 1 2 1 1 3 2 0 4 2 0 “conceptually”... Group dc 1 1 2*0 * = comparison group
Interpretations for dummy coded binary variables Bivariate Regression R² is effect size & F sig-test of group difference a-- mean of comparison/control condition/group b -- tells size & direction of y mean difference between groups (t-test of b is significance test of mean differences) Multivariate Regression (including other variables) b -- tells size & direction of mean difference between the groups, holding all other variables constant (controlling for) (t-test of b is test of group mean difference beyond that accounted for by other predictors -- ANCOVA) a-- the expected value of y if value of all predictors = 0 Correlation r -- tells direction & strength of the predictor-criterion relationship -- tells which coded group has the larger mean criterion scores (significance test of r is test of mean difference)
Effects Coding for two-category variables • need 2 codes (since there is 1 BG df) • comparison or control condition/group gets coded “-1” • the treatment or target group gets coded “1” For several participants... Case group ec 1 1 1 2 1 1 3 2 -1 4 2 -1 “conceptually”... Group ec 1 1 2*-1 * = comparison group
Interpretations for effect coded binary variables Bivariate Regression R² is effect size & F sig-test of group difference a– grand mean of all participants/groups b -- tells size & direction of y mean difference between target group & grand mean (t-test of b is significance test of that mean) Multivariate Regression (including other variables) b -- tells size & direction of mean difference between target group & grand mean, holding all other variables constant (t-test of b is test of that mean difference beyond that accounted for by other predictors -- ANCOVA) a-- the expected value of y if value of all predictors = 0 Correlation r -- tells direction & strength of the predictor-criterion relationship -- tells which coded group has the larger mean criterion scores (significance test of r is test of mean difference)
Dummy Coding for multiple-category variables • can’t use the 1=Tx1, 2=Tx2, 3=Cx values put into SPSS • - conditions aren’t quantitatively different • need k-1 codes (one for each BG df) • comparison or control condition/group gets “0” for all codes • each other group gets “1” for one code and “0” for all others For several participants... Case group dc1 dc2 1 1 1 0 2 1 1 0 3 2 0 1 4 2 0 1 5 3 0 0 6 3 0 0 “conceptually”... Group dc1dc2 1 10 2 01 3*00 * = comparison group
Interpreting Dummy Codes for multiple-category variables • Multiple Regression including only k-1 dummy codes • R² is effect size & F sig-test of group difference • a-- mean of comparison or control condition/group • each b-- tells size/direction of y mean dif of that group & control (t-test of b is significance test of the mean difference) • Multivariate Regression (including other variables) • b -- tells size/direction of y mean dif of that group & control, holding all other predictor variable values constant (controlling for) • (t-test of b is test of y mean difference between groups, beyond that accounted for by other predictors -- ANCOVA) • a-- the expected value of y if value of all predictors = 0 • Correlation • Don’t interpret the r of k-group dummy codes !!!!!!! • more later
A set of k-1 dummy codes is the “analytic comparisons” we looked at in Psyc941 • notice -- won’t get all pairwise information • - for k=3 groupsyou’ll get 2 of 3 pairwise comparisons • - for k=4 groupsyou’ll get 3 of 6 pairwise comparisons • - for k=5 groupsyou’ll get 4 of 10 pairwise comparisons • often “largest” or “most common” group is used as comparison • - give comparison of each other group to it • - but doesn’t give comparisons among the others • using comparison group with “middle-most mean” • G1 = 12 G2 = 10 G3 = 8 use G2 as comparison • dc1 = 1 0 0 (G1 vs G2)dc2 = 0 0 1 (G3 vs G2) • remember that the Omnibus-F tells us about the largest pairwise dif The omnibus F(2,57) with p < .05 tells 12 > 8 dc1 p < .05 tells 12 > 10dc2 p < .05 tells 10 > 8 The obmnibus F(2,57) with p < .05 tells you 12 > 8 dc1 p > .05 tells 12 = 10dc2 p > .05 tells 10 = 8
We (usually) don’t interpret bivariate correlations between Dummy codes for k>2 groups and the criterion.Why?? The b-weights of k-group dummy codes have the interpretation we give them in a multiple regression because of the collinearity pattern produced by the set of coding weights Correlated with the criterion separately, they have different meanings that we (probably) don’t care about Group dc1dc2 1 10 2 01 3*00 Taken by itself, dc1 compares Group 1 with the average of Groups 2 & 3 – a complex comparison & not comparable to the interpretation of b1 in the multiple regression Taken by itself, dc2 compares Group 1 with the average of Groups 1 & 3 – another different complex comparison & not comparable to the interpretation of b2 in the multiple regression
Effect Coding for multiple-category variables • again need k-1 codes (one for each BG df) • comparison/control condition/group gets “-1” for all codes • each other group gets “1” for one code and “0” for all others For several participants... Case group ec1 ec2 1 1 1 0 2 1 1 0 3 2 0 1 4 2 0 1 5 3 -1 -1 6 3 -1 -1 “conceptually”... Group ec1ec2 1 10 2 01 3*-1-1 * = comparison group
Interpreting Effects Codes for multiple-category variables • Multiple Regression including only k-1 effects codes • R² is effect size & F sig-test of group difference • a– grand mean of all participants/groups • each b-- tells size/direction of mean dif that group & grand mean (t-test of b is significance test of the mean difference) • Multivariate Regression (including other variables) • b -- tells size/direction of y mean dif of that group & grand mean, holding all other predictor variable values constant • (t-test of b is test of difference between that group mean & grand mean controlling for other predictors -- ANCOVA) • a-- the expected value of y if value of all predictors = 0 (which no one has!) • Correlation • Don’t interpret the r of k-group effect codes !!!!!!! • next slide
We (usually) don’t interpret bivariate correlations between Effect codes for k>2 groups and the criterion.Why?? The b-weights of k-group effect codes have the interpretation we give them in a multiple regression because of the collinearity pattern produced by the set of coding weights Correlated with the criterion separately, they have different meanings that we (probably) don’t care about Group ec1ec2 1 10 2 01 3*-1-1 Taken by itself, ec1 appears to be a quantitative variable that lines up the groups 3 – 2 –1, with equal spacing – not true!! Taken by itself, ec2 appears to be a quantitative variable that lines up the groups 3 – 1 –2, with equal spacing – not true!!
Comparison codes for multi-category predictors • This is the same thing as “simple and complex analytic comparisons • can be orthogonal or not • folks who like them - like the “focused nature” of comparisons • those who don’t - don’t like the “untested assumptions” &/or dissimilarity to more common pairwise comparisons • Example… • these codes will.. • Compare average of two Tx groups to the control • Compare the two TX groups • Each b is the specific mean difference & t is the significance test Tx1 Tx2 Cx cc1 1 1 -2 cc2 1 -1 0 For these codes, we could interpret the r of cc1 – T1 &T 2 vs Cx But we should not interpret the r from cc2 – is not a quant var!!!