HEC-HMS
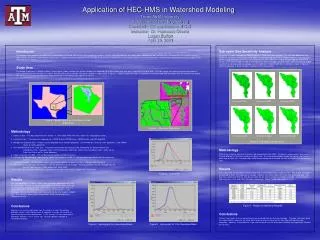
HEC-HMS. Hydrologic Modeling on Lower Colorado Basin Ki-Weon Seo. Study Area-Lower Colorado Basin. Real data. Nov/01/2000 ~ Nov/06/2000 (Hourly data) 4 Precipitation gages (1) Town lake near Longhorn dam (2) Buckners creek near muldoon (3) Colorado river above LaGrange

HEC-HMS
E N D
Presentation Transcript
HEC-HMS Hydrologic Modeling on Lower Colorado Basin Ki-Weon Seo
Real data • Nov/01/2000 ~ Nov/06/2000 (Hourly data) • 4 Precipitation gages (1) Town lake near Longhorn dam (2) Buckners creek near muldoon (3) Colorado river above LaGrange (4) Colorado river at Wharton
Real data • 3 Discharge gages (1) Onion creek at US Hwy 183 (2) Colorado river above LaGrange (3) Colorado river at Wharton • Source Town lake near Longhorn dam
Basin Model 1. Loss Rate - Initial and Constant - SCS Curve Number 2. Transform - Snyder’s Unit Hydrograph 3. Base flow - No base flow 4. Routing - Lag and Muskingum
Meteorologic Model 1. Precipitation - Nov/01/2000 ~ Nov/06/2000 2. Evaportranspiration - No evaportranspiration
Result • Initial and Constant Loss Rate (1) Calibrating Muskingum k and x (2) Calibrating Initial and Constant Loss rate • SCS Curve Number (1) Calibrating SCS CN.
Calibrating at Wharton Optimization Schematic
Calibrating at Wharton Objective function value
Calibrating at Wharton Simulated and observed hydrographs
Calibrating at Wharton Scatter graph of simulated and observed hydrographs
Calibrating at Wharton Residual graph of simulated and observed hydrographs
Calibrating at LaGrange Optimization Schematic
Calibrating at LaGrange Objective function value
Calibrating at LaGrange Simulated and observed hydrographs
Calibrating at LaGrange Scatter graph of simulated and observed hydrographs
Calibrating at LaGrange Residual graph of simulated and observed hydrographs
Discussion . SCS CN method is recommended . We need more data for Muskingum . Calibration at each subbasin will improve the results
acknowledgment • Sarah Stone • Chris Riley