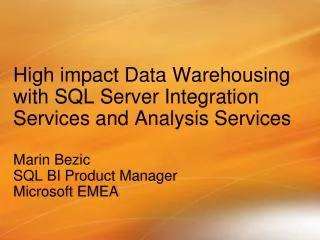
High impact Data Warehousing with SQL Server Integration Services and Analysis Services
High impact Data Warehousing with SQL Server Integration Services and Analysis Services. Marin Bezic SQL BI Product Manager Microsoft EMEA. A DW architecture. Reports. Dashboards. Scorecards. Excel. BI tools. Analysis Services. Datawarehouse (SQL Server, Oracle, DB2, Teradata ).


High impact Data Warehousing with SQL Server Integration Services and Analysis Services
E N D
Presentation Transcript
High impact Data Warehousing with SQL Server Integration Services and Analysis Services Marin Bezic SQL BI Product Manager Microsoft EMEA
A DW architecture Reports Dashboards Scorecards Excel BI tools Analysis Services Datawarehouse (SQL Server, Oracle, DB2, Teradata) Integration Services SQL/Oracle SAP/Dynamics Legacy Text XML
Session Objectives • Assumptions • Experience with SSIS and SSAS • Goals • Discuss design, performance, and scalability for building ETL packages and cubes (UDMs) • Best practices • Common mistakes
SQL Server 2005 BPA availability! • BPA = Best Practice Analyzer • Utility that scans your SQL Server metadata and recommends best practices • Best practices from dev team and Customer Support Services • What’s new: • Support for SQL Server 2005 • Support for Analysis Services and Integration Services • Scan scheduling • Auto update framework • CTP available now, RTM April • http://www.microsoft.com/downloads/details.aspx?FamilyId=DA0531E4-E94C-4991-82FA-F0E3FBD05E63&displaylang=en
Agenda • Integration Services • Quick overview of IS • Principles of Good Package Design • Component Drilldown • Performance Tuning • Analysis Services • UDM overview • UDM design best practices • Performance tips
What is SQL Server Integration Services? • Introduced in SQL Server 2005 • The successor to Data Transformation Services • The platform for a new generation of high-performance data integration technologies
Alerts & escalation Call center data: semi structured Data mining ETL Text mining Staging Legacy data: binary files Staging Warehouse ETL Hand coding Staging Cleansing & ETL Reports Application database ETL Mobile data ETL Objective: Before SSIS • Integration and warehousing require separate, staged operations. • Preparation of data requires different, often incompatible, tools. • Reporting and escalation is a slow process, delaying smart responses. • Heavy data volumes make this scenario increasingly unworkable.
Alerts & escalation Mobile data Text mining components Call center: semi-structured data Merges Data-cleansing components Data mining components Standard sources Custom source Warehouse Legacy data: binary files Reports SQL Server Integration Services Application database Changing the Game with SSIS • Integration and warehousing are a seamless, manageable operation. • Source, prepare, and load data in a single, auditable process. • Reporting and escalation can be parallelized with the warehouse load. • Scales to handle heavy and complex data requirements.
Control Flow (Runtime) A parallel workflow engine Executes containers and tasks Data Flow (“Pipeline”) A special runtime task A high-performance data pipeline Applies graphs of components to data movement Component can be sources, transformations or destinations Highly parallel operations possible SSIS Architecture
Agenda • Overview of Integration Services • Principles of Good Package Design • Component Drilldown • Performance Tuning
Principles of Good Package Design - General • Follow Microsoft Development Guidelines • Iterative design, development & testing • Understand the Business • Understanding the people & processes are critical for success • Kimball’s “Data Warehouse ETL Toolkit” book is an excellent reference • Get the big picture • Resource contention, processing windows, … • SSIS does not forgive bad database design • Old principles still apply – e.g. load with/without indexes? • Platform considerations • Will this run on IA64 / X64? • No BIDS on IA64 – how will I debug? • Is OLE-DB driver XXX available on IA64? • Memory and resource usage on different platforms
Principles of Good Package Design - Architecture • Process Modularity • Break complex ETL into logically distinct packages (vs. monolithic design) • Improves development & debug experience • Package Modularity • Separate sub-processes within package into separate Containers • More elegant, easier to develop • Simple to disable whole Containers when debugging • Component Modularity • Use Script Task/Transform for one-off problems • Build custom components for maximum re-use
Principles of Good Package Design - Infrastructure • Use Package Configurations • Build it in from the start • Will make things easier later on • Simplify deployment Dev QA Production • Use Package Logging • Performance & debugging • Build in Security from the start • Credentials and other sensitive info • Package & Process IP • Configurations & Parameters
Principles of Good Package Design - Development • SSIS is visual programming! • Use source code control system • Undo is not as simple in a GUI environment! • Improved experience for multi-developer environment • Comment your packages and scripts • In 2 weeks even you may forget a subtlety of your design • Someone else has to maintain your code • Use error-handling • Use the correct precedence constraints on tasks • Use the error outputs on transforms – store them in a table for processing later, or use downstream if the error can be handled in the package • Try…Catch in your scripts
Component Drilldown - Tasks & Transforms • Avoid over-design • Too many moving parts is inelegant and likely slow • But don’t be afraid to experiment – there are many ways to solve a problem • Maximize Parallelism • Allocate enough threads • EngineThreads property on DataFlow Task • “Rule of thumb” - # of datasources + # of async components • Minimize blocking • Synchronous vs. Asynchronous components • Memcopy is expensive – reduce the number of asynchronous components in a flow if possible – example coming up later • Minimize ancillary data • For example, minimize data retrieved by LookupTx
Debugging & Performance Tuning - General • Leverage the logging and auditing features • MsgBox is your friend • Pipeline debuggers are your friend • Use the throughput component from Project REAL • Experiment with different techniques • Use source code control system • Focus on the bottlenecks – methodology discussed later • Test on different platforms • 32bit, IA64, x64 • Local Storage, SAN • Memory considerations • Network & topology considerations
Debugging & Performance Tuning - Volume • Remove redundant columns • Use SELECT statements as opposed to tables • SELECT * is your enemy • Also remove redundant columns after every async component! • Filter rows • WHERE clause is your friend • Conditional Split in SSIS • Concatenate or re-route unneeded columns • Parallel loading • Source system split source data into multiple chunks • Flat Files – multiple files • Relational – via key fields and indexes • Multiple Destination components all loading same table
Debugging & Performance Tuning - Application • Is BCP good enough? • Overhead of starting up an SSIS package may offset any performance gain over BCP for small data sets • Is the greater manageability and control of SSIS needed? • Which pattern? • Many Lookup patterns possible – which one is most suitable? • See Project Real for examples of patterns:http://www.microsoft.com/sql/solutions/bi/projectreal.mspx • Which component? • Bulk Import Task vs. Data Flow • Bulk Import might give better performance if there are no transformations or filtering required, and the destination is SQL Server. • Lookup vs. MergeJoin (LeftJoin) vs. set based statements in SQL • MergeJoin might be required if you’re not able to populate the lookup cache. • Set based SQL statements might provide a way to persist lookup cache misses and apply a set based operation for higher performance. • Script vs. custom component • Script might be good enough for small transforms that’re typically not reused
Case Study - Patterns Use Error Output for handling Lookup miss Ignore lookup errors and check for null looked up values in Derived Column 83 seconds 105 seconds
Debugging & Performance Tuning – A methodology • Optimize and Stabilize the basics • Minimize staging (else use RawFiles if possible) • Make sure you have enough Memory • Windows, Disk, Network, … • SQL FileGroups, Indexing, Partitioning • Get Baseline • Replace destinations with RowCount • Source->RowCount throughput • Source->Destination throughput • Incrementally add/change components to see effect • This could include the DB layer • Use source code control! • Optimize slow components for resources available
Memory Constrained Reader and CPU Constrained Let it rip! Optimize the slowest Case Study - Parallelism • Focus on critical path • Utilize available resources
Summary • Follow best practice development methods • Understand how SSIS architecture influences performance • Buffers, component types • Design Patterns • Learn the new features • But do not forget the existing principles • Use the native functionality • But do not be afraid to extend • Measure performance • Focus on the bottlenecks • Maximize parallelism and memory use where appropriate • Be aware of different platforms capabilities (64bit RAM) • Testing is key
Agenda Server architecture and UDM basics Optimizing the cube design Partitioning and Aggregations Processing Queries and calculations Conclusion
Client Server Architecture Excel OLEDB ADOMD TCP Client Apps Analysis Server XMLA AMO IIS BIDS SSMS HTTP ADOMD .NET Profiler
Dimension An entity on which analysis is to be performed (e.g. Customers) Consists of: Attributes that describe the entity Hierarchies that organize dimension members in meaningful ways
Attribute Containers of dimension members. Completely define the dimensional space. Enable slicing and grouping the dimensional space in interesting ways. Customers in state WA and age > 50 Customers who are marriedand male Typically have one-many relationships City State, State Country, etc. All attributes implicitly related to the key
Ordered collection of attributes into levels Navigation path through dimensional space User defined hierarchies – typically multiple levels Attribute hierarchies – implicitly created for each attribute – single level Hierarchy Customers by Geography Customers by Demographics Country Marital State Gender City Customer Customer
Dimension Model Country Country State Marital City Gender Gender State Customer Customer Customer Age Gender Marital City Customer State Gender City Country Marital Customer Attributes Hierarchies
Cube Collection of dimensions and measures Measure numeric data associated with a set of dimensions (e.g. Qty Sold, Sales Amount, Cost) Multi-dimensional space Defined by dimensions and measures E.g. (Customers, Products, Time, Measures) Intersection of dimension members and measures is a cell (USA, Bikes, 2004, Sales Amount) = $1,523,374.83
A Cube Units of beer sold in Boston in January Bos M a r k e t NYC Chi Mar Feb Sea Time Jan Milk Beer Peas Corn Bread Product
Measure Group Group of measures with same dimensionality Analogous to fact table Cube can contain more than one measure group E.g. Sales, Inventory, Finance Multi-dimensional space Subset of dimensions and measures in the cube AS2000 comparison Virtual Cube Cube Cube Measure Group
Measure Group Measure Group
Agenda Server architecture and UDM Basics Optimizing the cube design Partitioning and Aggregations Processing Queries and calculations Conclusion
Top 3 Tenets of Good Cube Design Attribute relationships Attribute relationships Attribute relationships
Attribute Relationships One-to-many relationships between attributes Server simply “works better” if you define them where applicable Examples: City State, State Country Day Month, Month Quarter, Quarter Year Product Subcategory Product Category Rigid v/s flexible relationships (default is flexible) Customer City, Customer PhoneNo are flexible Customer BirthDate, City State are rigid All attributes implicitly related to key attribute
Attribute Relationships (continued) Country State Age Gender Marital City Customer
Attribute Relationships (continued) Country State Age Gender Marital City Customer
Attribute Relationships Where are they used? MDX Semantics Tells the formula engine how to roll up measure values If the grain of the measure group is different from the key attribute (e.g. Sales by Month) Attribute relationships from grain to other attributes required (e.g. Month Quarter, Quarter Year) Otherwise no data (NULL) returned for Quarter and Year • MDX Semantics explained in detail at: • http://www.sqlserveranalysisservices.com/OLAPPapers/AttributeRelationships.htm
Attribute RelationshipsWhere are they used? Storage Reduces redundant relationships between dimension members – normalizes dimension storage Enables clustering of records within partition segments (e.g. store facts for a month together) Processing Reduces memory consumption in dimension processing – less hash tables to fit in memory Allows large dimensions to push 32-bit barrier Speeds up dimension and partition processing overall
Attribute RelationshipsWhere are they used? Query performance Dimension storage access is faster Produces more optimal execution plans Aggregation design Enables aggregation design algorithm to produce effective set of aggregations Dimension security DeniedSet = {State.WA} should deny cities and customers in WA – requires attribute relationships Member properties Attribute relationships identify member properties on levels
Attribute RelationshipsHow to set them up? Creating an attribute relationship is easy, but … Pay careful attention to the key columns! Make sure every attribute has unique key columns (add composite keys as needed) There must be a 1:M relation between the key columns of the two attributes Invalid key columns cause a member to have multiple parents Dimension processing picks one parent arbitrarily and succeeds Hierarchy looks wrong!
Attribute RelationshipsHow to set them up? Don’t forget to remove redundant relationships! All attributes start with relationship to key Customer City State Country Customer State (redundant) Customer Country (redundant)
Attribute RelationshipsExample Time dimension Day, Week, Month, Quarter, Year Year: 2003 to 2010 Quarter: 1 to 4 Month: 1 to 12 Week: 1 to 52 Day: 20030101 to 20101231 Year Quarter Week Month Day
Attribute RelationshipsExample Time dimension Day, Week, Month, Quarter, Year Year: 2003 to 2010 Quarter: 1 to 4 - Key columns (Year, Quarter) Month: 1 to 12 Week: 1 to 52 Day: 20030101 to 20101231 Year Quarter Week Month Day
Time dimension Day, Week, Month, Quarter, Year Year: 2003 to 2010 Quarter: 1 to 4 - Key columns (Year, Quarter) Month: 1 to 12 - Key columns (Year, Month) Week: 1 to 52 Day: 20030101 to 20101231 Attribute RelationshipsExample Year Quarter Week Month Day
Time dimension Day, Week, Month, Quarter, Year Year: 2003 to 2010 Quarter: 1 to 4 - Key columns (Year, Quarter) Month: 1 to 12 - Key columns (Year, Month) Week: 1 to 52 - Key columns (Year, Week) Day: 20030101 to 20101231 Attribute RelationshipsExample Year Quarter Week Month Day