Download
1 / 24
240 likes | 853 Vues
Housing Market Comments – The focus this month is on the economy – what kind of recovery to expect. September 17, 2009

E N D
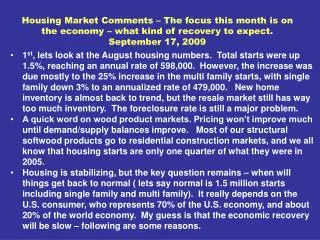
Housing Market Comments – The focus this month is on the economy – what kind of recovery to expect.September 17, 2009 • 1st, lets look at the August housing numbers. Total starts were up 1.5%, reaching an annual rate of 598,000. However, the increase was due mostly to the 25% increase in the multi family starts, with single family down 3% to an annualized rate of 479,000. New home inventory is almost back to trend, but the resale market still has way too much inventory. The foreclosure rate is still a major problem. • A quick word on wood product markets. Pricing won’t improve much until demand/supply balances improve. Most of our structural softwood products go to residential construction markets, and we all know that housing starts are only one quarter of what they were in 2005. • Housing is stabilizing, but the key question remains – when will things get back to normal ( lets say normal is 1.5 million starts including single family and multi family). It really depends on the U.S. consumer, who represents 70% of the U.S. economy, and about 20% of the world economy. My guess is that the economic recovery will be slow – following are some reasons.
Many analysts including the government are saying 3rd quarter GDP will • be positive, and that we’re out of the woods. But, a lingering question • is “what happens when the stimulus spending stops?” • Lets look at the U.S. economy, and specifically the consumer. The • consumer is heavily in debt, and in a low inflation environment, the • burden of servicing that debt is more onerous. Income growth has • stagnated for the past several years, and, in past 9 months, it has • actually shrunk. In real dollars ( inflation removed), the situation is • worse. The job situation is improving, but we’re still in a real mess. • The U.S. consumer is finally saving for a rainy day – a key question is • whether this is a cyclical ( short term) thing or secular ( long term). If • secular, and consumer spending falls back to 65% or lower share • of the economy, this has major implications for our retail sector, housing, • and just about everything else. Recent evidence - the savings rate is • about 4%( recently, it was negative); house size is falling for the 1st time • in many years. Will this continue? I don’t know. • And, the federal government is heavily in debt too. This has implications • for the dollar and, indirectly, interest rates.
We haven’t said much about commercial real estate, but that market is also having problems with many developers unable to renew their mortgages. This is causing an increase in foreclosures, and this is putting pressure on smaller to mid size banks as they focused on this market while the larger banks focused on residential markets. The result of of this development is that credit will remain tight. • Bottom line – people need jobs, income, and access to credit to obtain and carry a mortgage. • These are my reasons why the recovery in the economy will be slow – same for the housing recovery. But, the good news is that things are getting better – we have turned the corner - ….
Single Family Starts have Stabilized but, they are still down 73% from the peak (Jan 2006) Thousand units, SAAR Source: Census
Another metric – new home inventory is approaching “good level” Months supply, single family Trend ~ 6 months
Housing Inventorystill “the problem”, but, its improving!!! Thousand Units, Single Family Monthly - 2008 – 2009 (SAAR) Annual – 1990 - 2007 TREND Source: U.S. Census (http://www.census.gov/hhes/www/housing/hvs/hvs.html )
Wood product pricing won’t get better until housing strengthens! Following slides show why
Softwood Market Shares: Average during 1998 – 2007 U.S. Structural Panels U.S. Softwood Lumber Export 2% Export 2% Industrial 16% Industrial 17% R&A 30% R&A 19% New Residential* 40% New Residential* 53% NR. 10% NR 12% *New Residential incl. SF, MF, and Mobile Homes Source : Lumber – WWPA; Panels - APA
Lumber and Panel Prices Follow Housing Between 2005 – 2008: North American lumber production down 31% ( 23 BBF), prices down 31% ; structural panel production down 12.4 BSF, prices down 29% Starts ( Million units) FOB, Price, $/M
Housing is stabilizing, albeit at low levels Foreclosures remain problem – add to inventory and weak pricing Consensus outlook is for slow recovery in housing
Why a slow recovery ? Too much housing inventory Need stronger demand to sop up inventory, but Weak Economy high unemployment + weak income growth - (negative in 09) + consumer debt = weak consumer spending
Government spending 20% Net Exports (- 5)% U.S. Economy in 2008 Non residential investment 11.7% Consumer spending 70% Residential Investment ( incl R&A) 3.3% Source: BEA ( http://bea.gov/national/nipaweb )
Consumer spending is 70% of the U.S. economy ( and big part of global economy) Economy won’t get better until consumer spending improves and that will be difficult due to high levels of debt exacerbated by low inflation ( i.e, debt burden is more onerous in low inflation environment) Wild card - - Implications for the economy (and wood products) if consumer spending pulls back to 65% ( or lower) of the economy? Long term, this is good ( less consumption = more investment) = Better productivity = more competitive = higher GDP
Ratio of Household Debt* to GDP Starting to get handle on debt QTR: 2008 – Q12009 Annual: 1980 - 2007 *Debt = home mortgage plus consumer credit Source: U.S. Federal Reserve Flow of Funds accounts, table D3
Household Debt* to Personal Disposable Income QTR: 2008- 2009 Annual: 1980 - 2007 * Home mortgage plus consumer credit Source: Federal Reserve, Flow of Funds Account Table D3, F10
Wages & Salary Trendsanemic growth QTR, Current Billion$, SAAR Source: Bureau of Economic Analysis
Wage and Salary Trends Dramatic slowdown in past 12 months Source: BEA
Cumulative Net change in Non Farm Payrolls6.65 million job losses in past 20 months3.8 million to date in 2009 –unemployment at 9.7% - highest in 25 years ( thousand ) Aug 2009 (216,000) Source: U.S. BLS ( www.bls.gov )
But, Employment Situation getting better Net change in non farm payrolls, 000 Source: U.S. BLS ( www.bls.gov )
Consumer Confidencegetting better, slowly consumer spending is 70% of the economy - - - spending depends on confidence, income, job situation, future expectations, …. Index: 1985 = 100 August 2009 Source: Conference Board
But, the Federal Budget Deficit outlook is getting worse Deficits can’t go on indefinitely - Sometime, we’re going to have inflation, higher taxes, and fewer services - $ million in past 19 years, the govt has run deficits 80% of the time. Source: Federal Reserve
Interest on the Debt is now the 4th largest item in the budget behind defense, social security, and Medicare/ medicaid Source: U.S. government, Treasury direct (http://www.treasurydirect.gov/NP/BPDLogin?application=np )
Single Family Home size – Peaking? Qtr data, Avg SF floor area Q4 07 to Q3 09? Levels off during recessions Q2 90 to Q1 91 Source: Census( http://www.census.gov/const/www/newresconstindex.html ),
Basic math tells us that home prices and incomes must trend together – we’re getting there Income and Price set to Index of: 1990 = 100 correction Sustainable relationship Sources: NAHB & NAR – Home prices; U.S. Census (http://www.census.gov/hhes/www/income/histinc/incfamdet.html) - family incomes