
Uploaded by
elina
1 SLIDES
385 VUES
10LIKES
Statistics
DESCRIPTION
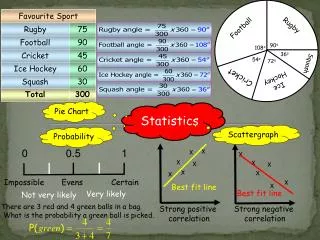
x. x. x. x. x. x. x. x. x. x. x. x. Favourite Sport. Football. Rugby. Rugby. 75. Football. 90. 90 o. 108 o. Cricket. 45. 36 o. 54 o. 72 o. Squash. Ice Hockey. 60. Cricket. Squash. 30. Ice Hockey. Total. 300. Pie Chart. Statistics. Scattergraph. Probability. 0.
Download
1 / 1
Télécharger la présentation 
Statistics
An Image/Link below is provided (as is) to download presentation
Download Policy: Content on the Website is provided to you AS IS for your information and personal use and may not be sold / licensed / shared on other websites without getting consent from its author.
Content is provided to you AS IS for your information and personal use only.
Download presentation by click this link.
While downloading, if for some reason you are not able to download a presentation, the publisher may have deleted the file from their server.
During download, if you can't get a presentation, the file might be deleted by the publisher.
E N D
Presentation Transcript
x x x x x x x x x x x x Favourite Sport Football Rugby Rugby 75 Football 90 90o 108o Cricket 45 36o 54o 72o Squash Ice Hockey 60 Cricket Squash 30 Ice Hockey Total 300 Pie Chart Statistics Scattergraph Probability 0 0.5 1 Impossible Evens Certain Best fit line Best fit line Very likely Not very likely There are 3 red and 4 green balls in a bag. What is the probability a green ball is picked. Strong positive correlation Strong negative correlation


More Related