Download
1 / 10
100 likes | 220 Vues
Dive into the collision theory and activation energy explaining how different factors influence reaction rates, illustrated through the Maxwell-Boltzmann apparatus and kinetic energy distribution of atoms.

E N D
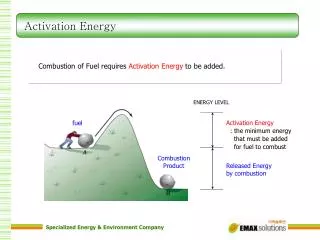
The Collision Theory and Activation Energy Explaining how and why factors affect reaction rates
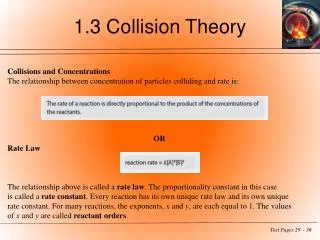
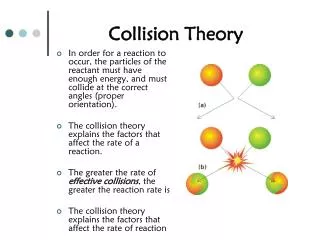
The Maxwell-Boltzmann apparatus • Maxwell and Boltzmann performed an experiment to determine the kinetic energy distribution of atoms • Because all atoms of an element have roughly the same mass, the kinetic energy of identical atoms is determined by velocity (KE= ½mv2)
The Maxwell-Boltzmann apparatus • Maxwell and Boltzmann performed an experiment to determine the kinetic energy distribution of atoms • Because all atoms of an element have roughly the same mass, the kinetic energy of identical atoms is determined by velocity (KE= ½mv2)
The Maxwell-Boltzmann apparatus • Maxwell and Boltzmann performed an experiment to determine the kinetic energy distribution of atoms • Because all atoms of an element have roughly the same mass, the kinetic energy of identical atoms is determined by velocity (KE= ½mv2)
Fraction of molecules Kinetic energy The Maxwell-Boltzmann distribution Basically, if we plot the intensity of the dots on a graph we get a graph of fraction of atoms/molecules vs. kinetic energy: • The resulting disk looks like this: Molecules hit disk first Molecules hit disk last
KE velocity Why is the graph skewed? • This curve is characteristic of all molecules • The curve is elongated due to how atoms collide, and to the units of the graph • Recall all particles are in motion. An average speed will be reached. • The graph is skewed because 0 is the lower limit, but theoretically there is no upper limit • More than that the graph is skewed because the x-axis has units of energy not velocity Same data, different axes. E.g. v=1, KE=1 v=2, KE=4 v=3, KE=9
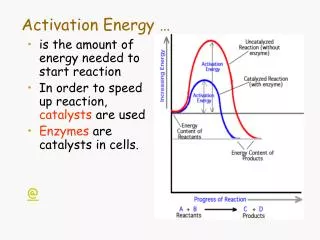
Temperature and reaction rate • By understanding the Maxwell-Boltzmann distribution, we can begin to understand the two reasons why an increase in temperature causes an increase in reaction rate • Read pg. 754 - 755 (starting at 18.7), answer questions 18.61 - 18.64 on pg. 773 and … Q- Look back at the five factors that affect reaction rates. Three of these factors can be (at least in part) explained by the collision theory. Identify the 3 factors and explain how the affect of each can be explained with reference to the collision theory
Temperature and reaction rate 18.61 Rates are typically 2-3 times greater 18.62 Rate is proportional to the number of collisions per second among reactants 18.63 reactant orientation and activation energy 18.64 This happens because a larger fraction of the reactant molecules possess the minimum energy necessary to surpass Ea. A- Ability to meet (molecules that are well mixed will have a greater chance of colliding) Concentration of reactants (more molecules means more collisions) Temperature (faster moving molecules means more collisions per unit of time). Plus…
Fraction of molecules Ea Kinetic energy Temperature and reaction rate • Demonstrations: Mg + O2, H2 + O2 • By increasing the temperature, a small number of molecules reach Ea. The reaction is exothermic, further increasing temperature and causing more molecules to reach Ea, etc. • Draw the M-B distribution for H2 + O2 before heat was applied. Show how heat affects the diagram. Shift due to higher temperature
Transition state theory • Read remainder of 18.7 (pg. 756 – 757) For more lessons, visit www.chalkbored.com