Download
1 / 59
750 likes | 1.52k Vues
Unemployment. A measure of wasted resources…. The Short vs. The Long Run. At Full employment. Above Full employment. Total Production. Every year we produce more than the previous year. Full Employment Output Level: what we produce when unemployment is zero and there is no excess capacity.

E N D
Unemployment A measure of wasted resources… (c) 2002 Claudia Garcia-Szekely
The Short vs. The Long Run At Full employment Above Full employment Total Production Every year we produce more than the previous year Full Employment Output Level: what we produce when unemployment is zero and there is no excess capacity Below Full employment Time Output deviates from full employment level only during “short” periods of time. Eventually, output goes back to it’s full employment level. If we look at long intervals of time, the economy can be expected to be at or near full employment.
Real GDP the economy produces when workers and factories are fully employed Potential GDP Actual Output Level
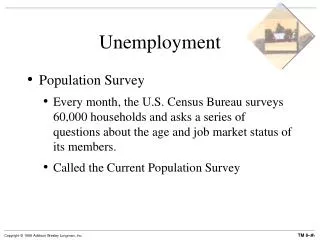
Measuring Unemployment Since 1940. • Unemployment is measured by the Bureau of Labor Statistics (BLS) part of the Department of Labor. • Data is compiled from monthly surveys (60,000 households) • Current Population Survey • Data does not come from unemployment insurance (UI) records… • UI is one of many factors used. (c) 2002 Claudia Garcia-Szekely
Basic Concepts • If you have a job, you are employed • If you do not have a job but you are available and looking for work, you are unemployed. • If you are neither employed nor available and looking for a job you are not in the labor force. (c) 2002 Claudia Garcia-Szekely
Employed • Full time, part time and temporary work… • Worked at least ONE hour or more forpay or profit during the survey week. • Worked 15 hours or more without pay in a family business. • Temporarily absent from work • Illness, vacation, labor dispute, etc. (c) 2002 Claudia Garcia-Szekely
Unemployed • Do not have a job. • Available for work. • Made specific efforts to find a a job during the previous four weeks. • Not working, waiting to be called back to a job from which they were temporarily laid off. (c) 2002 Claudia Garcia-Szekely
Not in the Labor Force • Those who have no job and are not looking for a job. • Retired • Full time students • Home makers. • Volunteers • Institutional Population. • Mental Institutions • Prison • Military (c) 2002 Claudia Garcia-Szekely
Labor Force Participation Rate 65.7% 154M Labor Force X 100 = Active Population 154M 140M 234.3M LF = Employed + Unemployed 14M > 14M 9.09% Unemployed Unemployment Rate (Ur) = X 100 Labor Force 154M
Fewer men work outside the home 2008:73% More women work outside the home 2008: 58.7% (c) 2002 Claudia Garcia-Szekely
Unemployment SEE PROGRESSION (c) 2002 Claudia Garcia-Szekely
We thank the Fed for this one… 7.9% Feb 7.7%
High inflation call the Fed! Fed works it’s magic through unemployment (c) 2002 Claudia Garcia-Szekely
Deflation The Great Recession (c) 2002 Claudia Garcia-Szekely
Majority of those who are unemployed find jobs in less than 5 weeks (c) 2002 Claudia Garcia-Szekely
Majority of those who are unemployed find jobs in less than 5 weeks Majority of those who are unemployed are unemployed for more than 6 months (c) 2002 Claudia Garcia-Szekely
Is Unemployment Measured Correctly? No. There are three problems with this statistic: • The Discouraged Worker Effect (c) 2002 Claudia Garcia-Szekely
Discouraged Workers are not in the Labor Force. A discouraged worker is someone who gave up looking for a job. • They are NOT counted as unemployed but should because they are part of the active population, and would work if a job was available. (c) 2002 Claudia Garcia-Szekely
LF = E + U 138.2+15.9=154.1 LF =_____ Ur =_____ 15.9/154.1*100=10.3% Unemployed Unemployed Unemployment Rate (Ur) = X 100 15.9M Labor Force Employed 138.2M
Unemployed Employed 15.9 138.2 1.1 give up looking for work LF =156-1.1=154.9 New Ur = When workers lose all hope of finding a job Unemployment rate decreases! 14.8/154.9=9.6% E=140 U=15.9-1.1=14.8 LF = 156 E=140 U=15.9 15.9/156=10.2% Ur =
Discouraged Worker Effect. • An increase in the number of discouraged workers shows up as a decrease in the unemployment rate! • During long recessions, more workers become discouraged reducing the Ur. During recessions true unemployment is underestimated (c) 2002 Claudia Garcia-Szekely
Discouraged Workers Thousands (c) 2002 Claudia Garcia-Szekely
Is Unemployment Measured Correctly? No. There are three problems with this statistic: • The treatment of part time work as full time. (c) 2002 Claudia Garcia-Szekely
Part Time Workers counted as Employed • Including those who worked only one hour/week • These individuals would work full time if a job was available… • They should be counted –at least partially- as unemployed. (c) 2002 Claudia Garcia-Szekely
Is Unemployment Measured Correctly? No. There are three problems with this statistic: • Underemployment (c) 2002 Claudia Garcia-Szekely
Underemployed workers counted as Employed A person working on a job that does not use his/her full potential is Underemployed • A computer programmer delivering pizzas. • Underemployed individuals are counted as employed even though their skills are unemployed. • There are no official statistics on underemployment: • Difficult to develop objective criteria. • Difficult to quantify loss to society. (c) 2002 Claudia Garcia-Szekely
The Unemployment Rate:Three Misrepresentations Not Unemployed Discouraged Workers Underestimate true Unemployment Counted as employed Part Time Workers Inflate Number employed Underestimate true Unemployment Under-employed Workers Counted as employed (c) 2002 Claudia Garcia-Szekely
Employed? Unemployed? Not in the LF? • After 14 months, Mrs. Smith gives up searching for a job. • Claudia reports wanting to work, but she made no specific efforts to find employment. • John works as a clerk in a government office. • Harry is in active duty in the military. • Raul was paid for 2 hours work during the survey week. • Joe is retired and volunteers his time at a hospital. • Anthony was given a 2 day suspension from work for being late. • Joseph works two days a week at a restaurant. • Mary, a part time teacher, reports searching unsuccessfully for a full time job. • Ron, a PhD in Philosophy, drives a delivery van after searching unsuccessfully for a job.
Suppose that the active population is 230 million, the labor force participation rate is 66% and the unemployment rate is 5%. If the number of discouraged workers increases by 5 million, what does the unemployment rate become? Active population is 30 million, labor force participation rate 60%, number of discouraged workers 2 million, number of people with full time jobs 13 million, number of people with part time jobs is 2 million. Calculate the unemployment rate.
Potential GDP Real GDP the economy produces when workers and factories are fully employed Output produced when unemployment is zero
Unemployment is never ZERO Even when the economy is growing at its “potential” there will be some workers unemployed. (c) 2002 Claudia Garcia-Szekely
Three types of unemployment: • Structural: workers who do not have skills currently in demand…there is no job for them. • Frictional: workers who have the necessary skills but have not found their job yet. • Cyclical: workers with the necessary skills for the job, but lack of demand prevents firms from hiring them. (c) 2002 Claudia Garcia-Szekely
The Full Employment Rate of Unemployment: Natural Rate At full employment: • CYCLICAL unemployment is zero. • Total unemployment is NOT zero. • There is frictional and structural unemployment. (c) 2002 Claudia Garcia-Szekely
Potential GDP Real GDP the economy produces when workers and factories are fully employed Output produced when cyclical unemployment is zero
Frictional 4% Structural 1% Three components to Unemployment Natural Rate of Unemployment 5% Ur=10% Between Jobs 4% Frictional 4% Unemployed due to recession 5% Cyclical 5% Recession Ends Unemployed due to lack of skills 1% Structural 1% Zero Cyclical Unemployment (c) 2002 Claudia Garcia-Szekely
The Natural Rate of Unemployment Natural Rate of Unemployment was estimated between 5 and 6%. Frictional Structural Natural + = (c) 2002 Claudia Garcia-Szekely
Cyclical? Structural? Frictional? • Richard loses his job at UPS due to a downturn in general business conditions. • Mark loses his job as a parking attendant. His job was replaced by a new automated system. • Sarah quits her job as a hostess to look for work that is more fun. • Andrew quits looking for work because he does not think he can find a suitable job. • Nancy lost her job as a real estate agent during the housing crisis. • Mathew just graduated from college and does not have a job yet. • Pedro lost his job as software developer for a weapons manufacturer. He is looking for a new job. • John lost his job as a public phone repairman because his skills are no longer needed.
True or False? Frictional unemployment is a "necessary" cost of a dynamic economy. Someone unemployed for a long period of time due to technological change would be described as structurally unemployed. (c) 2002 Claudia Garcia-Szekely
Unemployment increases Inequality “When the economy catches a cold minorities and young people get pneumonia” Alan Blinder (c) 2002 Claudia Garcia-Szekely
Less than HS 11.2% 7.9% HS graduates 6.7% Some College 3.8% Bachelor Degree and higher (c) 2002 Claudia Garcia-Szekely
How do you protect yourself from unemployment? STAY IN SCHOOL (c) 2002 Claudia Garcia-Szekely
The Cost of Unemployment2. Lost Output: Okun’s Law An extra percentage point of unemployment above the natural rate corresponds to an output gap of 2.5 percentage points of GDP. 14,000 *0.025 = 350 Billion worth of goods and services lost for each 1% extra unemployment
Okun’s Law: an example Ur (2007) = 4.9%; GDP in 2007 = 11,620b Ur (2008) = 7.2% Extra Unemployment = 7.2 – 4.9 = 2.3% Each 1% extra unemployment = 2.5% lost GDP Lost GDP = 2.3(2.5) = 5.75% Lost GDP = 11,620b (5.75%)= 668billion dollars worth of goods and services. (c) 2002 Claudia Garcia-Szekely
Unemployment Costs: 3. Social Costs Increased suicide rates (video) (c) 2002 Claudia Garcia-Szekely
Practice Questions • Explain the Discouraged worker effect and how it affects the calculation of the unemployment rate. • Explain why the unemployment rate is never zero? • Explain why unemployment is underestimated by treating Full time and part time work the same. • Explain why unemployment is underestimated due to underemployment (c) 2002 Claudia Garcia-Szekely