Gene Expression Quantification in T2ECs Treated with T3 and RA: Analysis of Fold Variation
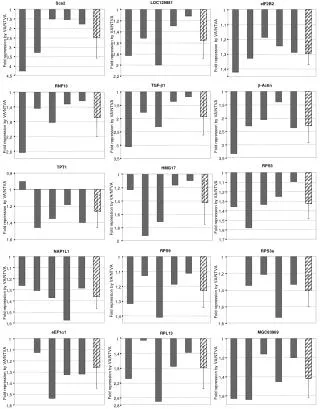
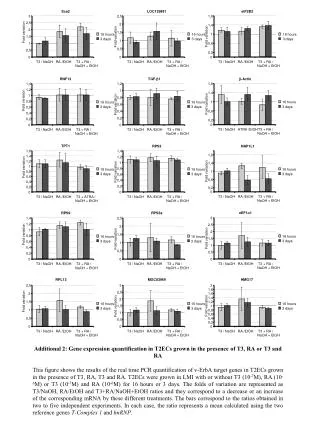
This study presents the gene expression quantification results of v-ErbA target genes in T2ECs cultured with T3 and RA. The cells were treated with T3 (10^-7M), RA (10^-6M), or a combination of both for durations of 16 hours or 3 days. Fold variation was analyzed using T3/NaOH, RA/EtOH, and T3+RA/NaOH+EtOH ratios, reflecting changes in mRNA levels due to treatment. The data presented are averages from 2-5 independent experiments, with reference genes T-Complex 1 and hnRNP utilized for normalization.

Gene Expression Quantification in T2ECs Treated with T3 and RA: Analysis of Fold Variation
E N D
Presentation Transcript
Sca2 LOC129881 eIF2B2 3 2,5 1,8 2,5 2 1,4 2 Fold variation 1,5 1 16 hours 16 hours 16 hours Fold variation 1,5 Fold variation 3 days 3 days 3 days 1 1 0,6 0,5 0,5 0,2 0 0 0 T3 / NaOH RA /EtOH T3 + RA / T3 / NaOH RA /EtOH T3 + RA / T3 / NaOH RA /EtOH T3 + RA / NaOH + EtOH NaOH + EtOH NaOH + EtOH -Actin RNF13 TGF-1 1,8 1,4 1,2 1,2 1 1,4 1 0,8 Fold variation 0,8 1 16 hours 16 hours 16 hours Fold variation 0,6 Fold variation 3 days 3 days 3 days 0,6 0,6 0,4 0,4 0,2 0,2 0,2 0 0 0 T3 / NaOH ATRA /EtOH T3 + RA / T3 / NaOH RA /EtOH T3 + RA / T3 / NaOH RA /EtOH T3 + RA / NaOH + EtOH NaOH + EtOH NaOH + EtOH TPT1 NAP1L1 RPS3 1,6 1,4 1,8 1,4 1,2 1,2 1 1,4 1 Fold variation 0,8 16 hours 16 hours 16 hours Fold variation 0,8 1 Fold variation 3 days 3 days 3 days 0,6 0,6 0,6 0,4 0,4 0,2 0,2 0,2 0 0 0 T3 / NaOH RA /EtOH T3 + RA / T3 / NaOH RA /EtOH T3 + ATRA / T3 / NaOH RA /EtOH T3 + RA / NaOH + EtOH NaOH + EtOH NaOH + EtOH eEF11 RPS9 RPS3a 3 1,4 2,5 1,2 2,5 2 1 2 Fold variation 1,5 0,8 16 hours 16 hours 16 hours Fold variation 1,5 Fold variation 3 days 3 days 3 days 0,6 1 1 0,4 0,5 0,5 0,2 0 0 0 T3 / NaOH RA /EtOH T3 + RA / T3 / NaOH RA /EtOH T3 + RA / T3 / NaOH RA /EtOH T3 + RA / NaOH + EtOH NaOH + EtOH NaOH + EtOH RPL13 MGC83969 HMG17 2,5 3 2 1,8 2,5 2 1,6 1,4 2 Fold variation 1,5 1,2 16 hours 16 hours 16 hours 1,5 1 Fold variation Fold variation 3 days 3 days 3 days 1 0,8 1 0,6 0,5 0,4 0,5 0,2 0 0 0 T3 / NaOH RA /EtOH T3 + RA / T3 / NaOH RA /EtOH T3 + RA / T3 / NaOH RA /EtOH T3 + RA / NaOH + EtOH NaOH + EtOH NaOH + EtOH Additional 2: Gene expression quantification in T2ECs grown in the presence of T3, RA or T3 and RA This figure shows the results of the real time PCR quantification of v-ErbA target genes in T2ECs grown in the presence of T3, RA, T3 and RA. T2ECs were grown in LMI with or without T3 (10-7M), RA (10-6M) or T3 (10-7M) and RA (10-6M) for 16 hours or 3 days. The folds of variation are represented as T3/NaOH, RA/EtOH and T3+RA/NaOH+EtOH ratios and they correspond to a decrease or an increase of the corresponding mRNA by these different treatments. The bars correspond to the ratios obtained in two to five independent experiments. In each case, the ratio represents a mean calculated using the two reference genes T-Complex 1 and hnRNP.