Sensornets and Global Change
210 likes | 360 Vues
Sensornets and Global Change. Invited Talk Greenovation Forum: Sensing and Sustainability Calit2@UCSD December 2, 2009. Dr. Larry Smarr Director, California Institute for Telecommunications and Information Technology Harry E. Gruber Professor, Dept. of Computer Science and Engineering

Sensornets and Global Change
E N D
Presentation Transcript
Sensornets and Global Change Invited Talk Greenovation Forum: Sensing and Sustainability Calit2@UCSD December 2, 2009 Dr. Larry Smarr Director, California Institute for Telecommunications and Information Technology Harry E. Gruber Professor, Dept. of Computer Science and Engineering Jacobs School of Engineering, UCSD Follow me on Twitter: http://twitter.com/lsmarr
San Diego Examples of Sensornets for Sustainability Building Sensing Wildfire Sensing What is a Sensornet? Coastal Sensing
Real-Time Monitoring of Building Energy Usage:UCSD Has 34 Buildings On-Line http://mscada01.ucsd.edu/ion/
Power Management in Mixed Use Buildings:The UCSD CSE Building is Energy Instrumented Source: Rajesh Gupta, CSE, Calit2 • 500 Occupants, 750 Computers • Detailed Instrumentation to Measure Macro and Micro-Scale Power Use • 39 Sensor Pods, 156 Radios, 70 Circuits • Subsystems: Air Conditioning & Lighting • Conclusions: • Peak Load is Twice Base Load • 70% of Base Load is PCs and Servers • 90% of That Could Be Avoided!
Cisco Vision: Mediating the Smart BuildingEnergy Dashboards, Demand Response, Fault Detection, Event Reporting, SmartGrid, etc. Trash Compactor EnergyWise Solar PV Sprinkler Electrical Meter Refrigeration Smart UPS HVAC Fire Alarm System CDU Lighting Control Boilers Filer VAV Sensor General Lighting Smoke Sensor FCU RTU UPS CRAC PDU Counter Heat Pump Break Glass Occupancy Detectors Meters Chilled Beam Wireless DSI/DALI Interface DCC PFU Sub Meters Sounder Open XML Interface Network as a Platform to Connect, Aggregate and Normalize Router Mediator Switch Source: Dave Clute, Cisco Connected Real Estate
Climate Change Will Pose Major Challenges to California in Water and Wildfires “It is likely that the changes in climate that San Diego is experiencing due to the warming of the region will increase the frequency and intensity of fires even more, making the region more vulnerable to devastating fires like the ones seen in 2003 and 2007.” California Applications Program (CAP) & The California Climate Change Center (CCCC) CAP/CCCC is directed from the Climate Research Division, Scripps Institution of Oceanography
Using Sensornetsto Accelerate Response to Wildfires Early on October 23, 2007, Harris Fire San Diego Photo by Bill Clayton, http://map.sdsu.edu/
NASA’s Aqua Satellite’s MODIS Instrument Provided “Situational Awareness” of the 14 SoCal Fires Calit2, SDSU, and NASA Goddard Used NASA Prioritization and OptIPuter Links to Cut time to Receive Images from 24 to 3 Hours October 22, 2007 Moderate Resolution Imaging Spectroradiometer (MODIS) NASA/MODIS Rapid Responsewww.nasa.gov/vision/earth/lookingatearth/socal_wildfires_oct07.html
MODIS Images Provide Targeting Information to NASA's EO-1 Satellite Which Cuts Through Smoke Composite of the Red, Blue, and Green Channels Three of the Shortwave Infrared Channels October 23, 2007 Witch Wildfire south of Escondido, California EO-1’s Hyperion Spectrometer Observes 220 Contiguous Wavelengths From Visible Light To Shortwave Infrared NASA/EO-1 Teamwww.nasa.gov/vision/earth/lookingatearth/socal_wildfires_oct07.html
1/3 Billion Pixel OptIPortal Linked to NASA GoddardEarth Satellite Images of October 2007 Wildfires Source: Falko Kuester, Calit2@UCSD
Prototyping Future Knowledge Integration Center for Emergency Response Where are the fires? Where are they going? NASA MODIS showing regional smoke NEXRAD near real-time radar of smoke Prof. Eric Frost – SDSU Viz Center Co-Director Imagery, Sensors, Videoconferencing Across the Border---Shared View with Mexico US Assets Shared via Network http://citi.sdsu.edu/
High Performance Wireless Research and Education Network http://hpwren.ucsd.edu/ National Science Foundation awards 0087344 and 0426879
HPWREN Topology, August 2008 Backbone/relay node Astronomy science site Biology science site Earth science site University site Researcher location Native American site First Responder site WIDC PSAP KYVW COTD KNW B081 BDC PFO GVDA Santa Rosa WMC RDM AZRY CRY BZN SND KSW FRD SMER DHL SO P474 SLMS Hans-Werner Braun, HPWREN PI MPO LVA2 BVDA SCS GLRS P478 P486 MTGY MVFD P510 WLA P483 CRRS GMPK RMNA USGC DSME CWC P506 P499 P480 P509 CE MONP UCSD P497 MLO 70+ miles to SCI DESC P494 P473 IID2 SDSU P500 CNM PL 155Mbps FDX 6 GHz FCC licensed 155Mbps FDX 11 GHz FCC licensed 45Mbps FDX 6 GHz FCC licensed 45Mbps FDX 11 GHz FCC licensed 45Mbps FDX 5.8 GHz unlicensed 45Mbps-class HDX 4.9GHz 45Mbps-class HDX 5.8GHz unlicensed ~8Mbps HDX 2.4/5.8 GHz unlicensed ~3Mbps HDX 2.4 GHz unlicensed 115kbps HDX 900 MHz unlicensed 56kbps via RCS network dashed = planned P066 POTR NSSS to CI and PEMEX approximately 50 miles: For Live Cameras See: http://hpwren.ucsd.edu/cameras/
Calit2 Added Live Feeds From HPWREN Cameras to KPBS Google Map
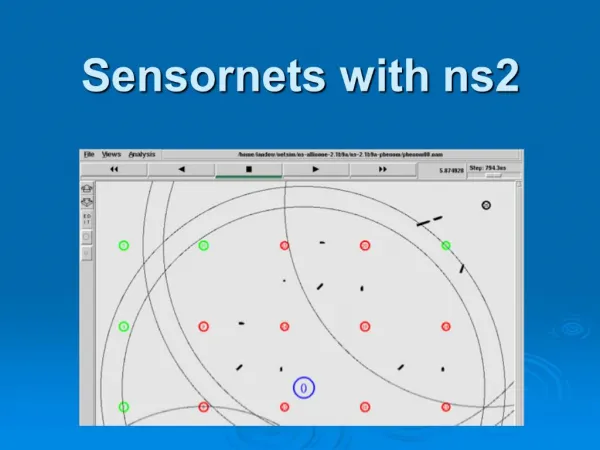
What is a SensorNet? • Sensors • Physical, Chemical, Biological, Imaging,… • Sensor Platform • Computing, Power, Storage, Radios, … • Telecommunications Infrastructure • Wired, Wireless, Internet, … • Sensor Arrays • Homogeneous, Inhomogeneous, Ad Hoc, … • Backend Data Systems • Storage, Compute, Analysis, Visualization
Creating Environmental Observatories – Combining OptIPortals with DataTurbine • Streaming Data Middleware System Satisfies Common Critical Infrastructure Requirements Across NSF-Sponsored Observing Systems: • Framework for Integration of Heterogeneous Instruments with Reliable Real-Time Data Transport • Sensors /Sensor Streams Become First-Class Objects • Comprehensive Suite Of Services For Data Management, Routing, Synchronization, Monitoring, and Visualization • All-Software Solution (Java) • Open Source Software- Apache 2.0 License • Used In NSF, NASA, NOAA, DOE Projects • NSF Support from SDCI program (Sept 07) • www.dataturbine.org Source: Tony Fountain, Sameer Tilak, Calit2
Streaming Underwater Video Sensors From Taiwan’s Kenting Reef to Calit2 March 6, 2008 Plan Accomplished! My next plan is to stream stable and quality underwater images to Calit2, hopefully by PRAGMA 14. --Fang-Pang to LS Jan. 1, 2008 UCSD: Rajvikram Singh, Sameer Tilak, Jurgen Schulze, Tony Fountain, Peter Arzberger NCHC : Ebbe Strandell, Sun-In Lin, Yao-Tsung Wang, Fang-Pang Lin
Towards a Total Knowledge Integration System for the Coastal Zone—SensorNets Linked to Fiber Cable Pilot Project Components • Moorings • Ships • Autonomous Vehicles • Satellite Remote Sensing • Drifters • Long Range HF Radar • Near-Shore Waves/Currents • COAMPS Wind Model • Nested ROMS Models • Data Assimilation and Modeling • Data Systems Yellow—Proposed Initial OptIPuter Backbone www.sccoos.org/
Coupling Data Assimilation Models to Remote Sensor Nets in Near Real Time Visualization: Philip Weber, Matthew Arrott, Calit2 Source: SCCOOS Long Range HF Radar Regional Ocean Modeling System (ROMS) http://ourocean.jpl.nasa.gov/
The Ocean Observatories Initiative (OOI) -- a Networked Infrastructure Of Science-Driven Sensor Systems The OOI Cyberinfrastructure30-40 Software Engineers Housed at Calit2@UCSD
Taking Sensornets to the Ocean Floor:Remote Interactive HD Imaging of Deep Sea Vent Source: John Delaney and Research Channel, U Washington 1 cm. White Filamentous Bacteria on 'Pill Bug' Outer Carapace High Definition Still Frame of Hydrothermal Vent Ecology 2.3 Km Deep Canadian-U.S. Collaboration