Download
1 / 37
370 likes | 545 Vues
Infrasound Measurements of a Railroad Bridge. Dr. Mihan McKenna Ms. Sarah McComas, Ms. Alanna Lester, and Dr. Paul Mlakar U.S. Army Engineer Research and Development Center Geotechnical and Structures Laboratory Mihan.H.McKenna@erdc.usace.army.mil Infrasound Technology Workshop 2008

E N D
Infrasound Measurements of a Railroad Bridge Dr. Mihan McKenna Ms. Sarah McComas, Ms. Alanna Lester, and Dr. Paul Mlakar U.S. Army Engineer Research and Development Center Geotechnical and Structures Laboratory Mihan.H.McKenna@erdc.usace.army.mil Infrasound Technology Workshop 2008 Bermuda November 3-7
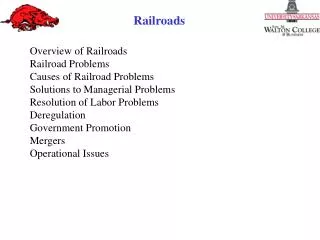
Overview • Experiment • Seismic, Infrasound, Acoustic and Meteorological measurements • Load testing • Modeling • Data Analysis • Future work
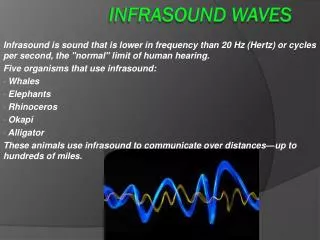
Motivations • Two prior papers indicated that infrasound was generated by bridges at sufficient energy to be detected over background noise at certain times of the day/year. • Traffic was not thought to be the source driver, perhaps natural sources such as wind excites the structure. • Acoustic ducting was required for propagation of infrasound energy. • Bridge may act as a dipole very close to source. • Donn, W., N. Balachandran, and G. Kaschak. Atmospheric Infrasound Radiated by Bridges. J. Acoust. Soc. Am., Vol. 56, No. 5, Nov. 1974. 1367-1370. • Kobayashi, Y. (1999) Infrasound Generated by a Highway Bridge. Butsuri-Tansa Vol. 52, No. 1. 54-60. (in Japanese)
Research Goals and Motivations • Purpose: • To determine the feasibility of remote assessment of bridges using infrasound acoustics in combination with seismic, meteorological and audible acoustic methods. • Desired Payoff: • Field personnel can deploy small-aperture infrasound arrays to ‘listen’ to a target structure and reliably analyze the situation without having to come into direct contact with the structure. Potential Results: Understand the physics of structure/atmosphere interactions resulting infrasound propagation. Foundation to create a catalog of bridge signatures to formulate algorithms for rapid remote assessment of infrastructure from bridges and other man-made structures.
Ft. Leonard Wood Deployment 3 SIAM arrays seismic, infrasound, acoustic and meteorological sensors. Array deployed at target bridge 2 standoff arrays
N 30meter Airport Site 2007-6-23 Actual sensor layout with scale
Test Area 2007-June N Fort Leonard Wood Rolla Wastewater Range 19.9 km Az 45 degrees Airport Range 26.867 km Az 39.4 degrees
The Infrasound Source Driver • Two 75 ton engines with eight flat cars of known weight • Series of passes: eight, four, two, no cars with two engines, one engine, stopped and moving • Controlled source with limited access during the experiment • Generates the vibrational modes of the bridge used to discriminate against other background ‘noise’ including several other bridges in the area, both military rail and civilian interstate.
Meteorological Measurements • Three met stations deployed with one per array consisting of temperature, pressure, wind speed, wind direction, dew point, humidity, soil moisture at two levels: 0.5 m and 2 m to estimate surface roughness. • Five local environmental monitoring stations on post, recording temperature, wind speed, wind direction every 15 minutes at two heights: 3 m and 10 m. • Collaboration with Hanscomb AFB for balloon radiosonde measurements. Total of five launches over the day of the test to ~ 30 km by state-of-the-art technology.
Meteorological Analysis • Only one inversion existed at the time of the train loading, at 0600 local time, before the test. There are no other ducting possibilities that day.
Propagation Modeling • InfraMAP modeling of the radiosonde data yielded only one successful run, at 6AM local time. • Data analysis searching for the bridge signature will focus on the time frame from 4 AM to 8 AM local time.
Integration of Source and Propagation Modeling • Identified the optimal time for observing a possible signal from the target bridge: between 4 AM and 8 AM local time. • What would the train signature look like? • Frequencies? • Continuous wave vs. discrete? • How does the source driver affect the signal?
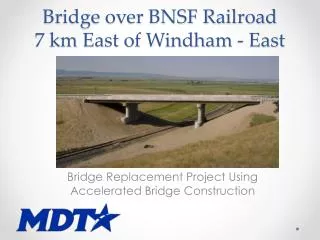
Load Testing Bridge Description: Type Pratt Truss (est. 1941) Material Steel (built-up) Span 7 Panels @ 23 ft.- 4 in. Height 30 ft. • Width • 15 ft.- 9 in. • Skew • 65 ˚ 13
Experimental Methodology Experimental load rating tests: Strain Gage (44 Used) Main Structural Elements One Train Engine • Strain Gage • BDI • Base Station • Auto Clicker • PC 14
Experimental Methodology • Example: Strain Gages Results Strain (me) Measurements
Experimental Methodology • Example: Strain Gages Results Strain (me) Measurements
COMPUTER MODEL • Mechanic of Materials • Stress • s=eE • Axial Force • F = sA • Obtain Analytical Internal Force • Analytical Model (Frame): • Main Steel Structural Elements • Built-up Sections Top Chord Diagonal Diagonal Chord Stringer Bottom Chord Floor Beam
Source Modeling • COMSOL Multiphysics Structural Mechanics Module • Key components • Simplified source to limit computational cost in large model • Accurate represents sound emitted from bridge • Technical difficulties • Bridge models to determine natural frequencies typically constructed using beam/truss elements • Beam/truss elements appear as point sources in acoustic analyses • Geometry of beam important for acoustic response • Natural frequencies of bridge do not provide obvious simplification of bridge structure – no single area dominates acoustics (e.g., bridge deck)
Ft. Leonard Wood Bridge z1 z2 • Pratt Truss Bridge • Struts included by specifying equal z-displacements at top of vertical member pairs x z
Natural Frequencies - Overview • Bridge shows 230 modes between 2 and 20 Hz • Three General Categories of Modes • Category 1: Relatively large deformation of many components (10%) • Category 2: Relatively large deformation of few components (33%) • Category 3: Relatively small deformation of components (57%) • First two categories should dominate acoustical energy
Relatively large deformation of many components Natural Frequency: Categories Relatively large deformation of a few components 10.0 Hz 13.6 Hz Relatively small deformation All results plotted w/ same deformation scaling factor 11.9 Hz
x z Natural Frequencies – Observation 2 hz • Modes show deformation in z direction, stringer: stays in plane • No modes show significant deformation in y direction • Bridge design requires large stiffness to resist deformation in y direction (designed to prevent cantilever bending)
Methodology • Rank bridge components based on source strength • Cross sectional area (CSA) perpendicular to direction of motion • Relative acceleration identified from natural frequency analysis • Develop acoustic model of critical components of bridge using shell elements of CSA • Develop detailed model using simple shape of beam CSA • Apply deformation mode from natural frequency analysis to each component • Use solution on outer boundary of acoustic model to drive infrasound solution over large domain
10 cm 4.7 m Effect of CSA on Acoustics Beam Model Deck Model Geometry Effect Models excited using same accelerations 150 m from source, normal above (y)
76 cm x z 10 cm 10 cm 10 cm 10 cm CSA Source Modelcenter to center spacing, real measurements • Representation of stringers (plan view) • Apply source acceleration in y direction (n = 1→5)
Comparison with Continuous Model • Do small gaps between stringers affect results even at 1 Hz (l=343 m, gap=0.76 m)? • Small gaps (relative to l) affect acoustic response YES
Summary • Ft. Leonard Wood bridge shows complex frequency response • Cross sectional area of beams has strong effect on acoustics • Small gaps relative to wavelength have effect on acoustics • Simple representation of bridge deck shows strong directionality
SIAM Data, raw infrasound IML Airport IML Airport IML Airport IML Bridge IML Bridge IML Bridge IML Bridge Interference infrasound generated by the train
What frequencies does the train generate? – Bridge Array Bridge Array – 3019 – NE of Bridge, further from train Bridge Array – 3020 SW of Bridge, closest to train at this time 50hz 40hz From 18:34:00 to 18:34:30 UTC [13:34:00 to 13:34:30 Local]
3012 – Airport Array What frequencies does the train generate? – Spectrogram of WTF and Airport Arrays for 18:34:00 to 18:34:30 UTC, [13:34:00 to 13:34:30 Local] 3015 – WTF Array 80hz 40hz 10hz WTF has frequencies up to and including 40hz Airport has low frequency (up to 6hz) and then high frequency (80hz)
Bridge signal from WTF array • Includes frequencies of interest (2, 10 and 13hz) - extremely low amplitude • Time series does not appear to have high activity • Additional higher frequencies (42 and 56hz) present and other additional transients (>50hz) • Higher frequencies (40 – 50hz) are persistent through the two hour time period Difficult to find arrivals in signal 2hz signal in time series FK analysis results correspond with bridge azimuth
Airport array frequencies 1005 UTC (0505 AM Local) Greater dynamic of frequencies present at airport Quiet times are clearer than WTF array (30hz signal visible) Loud times have greater frequency range 1052 UTC Bridge signature is clearer at the airport array despite the changing dynamics at the airport
Bridge signature from Airport Array • Station 3010 is not usable due to faunal mastication (rabbit) during data acquisition • Frequencies of interest present – with higher amplitudes than at WTF array • Time series shows that the airport array is more active than WTF array FK analysis indicates correct azimuth and apparent velocity
Future Modeling and Data Synthesis • The finite element model of the bridge created during the load testing will be uploaded to a multi-physics finite element package. • The bridge will be coupled into the atmosphere and vibrated at the frequencies observed during the test. • A representative source ‘package’ will be developed for use in infrasound propagation modeling software.