The Impact of 9/11 on Pregnancy Outcomes: Air Quality Perceptions among Pregnant Women
This study explores how the tragedy of September 11, 2001, influenced pregnancy outcomes through women's perceptions of air quality. The research involved 329 pregnant, non-smoking women from three hospitals near the World Trade Center. We examined birth outcomes and maternal characteristics while utilizing an innovative Perceived Air Quality Scale. Interviews collected data on demographics, reproductive history, and lifestyle exposures. Our findings highlight the correlations between modeled and reported air quality, shedding light on the potential health impacts of environmental factors on vulnerable populations.

The Impact of 9/11 on Pregnancy Outcomes: Air Quality Perceptions among Pregnant Women
E N D
Presentation Transcript
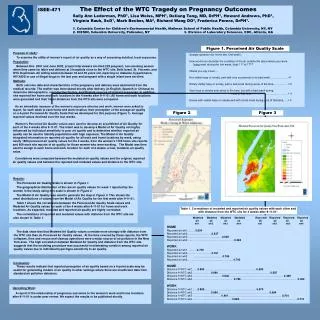
ISEE-471 The Effect of the WTC Tragedy on Pregnancy OutcomesSally Ann Lederman, PhD1, Lisa Weiss, MPH1, Deliang Tang, MD, DrPH1, Howard Andrews, PhD1, Virginia Rauh, ScD1, Mark Becker, MA2, Richard Wang DO3, Frederica Perera, DrPH1. • 1. Columbia Center for Children's Environmental Health, Mailman School of Public Health, Columbia University, NY, NY • 2. CIESIN, Columbia University, Palisades, NY 3. Division of Laboratory Sciences, CDC, Atlanta, GA Figure 1. Perceived Air Quality Scale Purpose of study: To examine the utility of women’s report of air quality as a way of assessing detailed, local exposures. Population: Between Dec. 2001 and June 2002, project interviewers enrolled 329 pregnant, non-smoking women when they came for labor and delivery at 3 hospitals close to the WTC site, Beth Israel, St. Vincents, and NYU Downtown. All willing women between 18 and 39 years old, reporting no diabetes, hypertension, HIV/AIDS or use of illegal drugs in the last year and pregnant with a single infant were enrolled. Methods: Birth outcome data and characteristics of the pregnancy and delivery were abstracted from the medical records. The mother was interviewed shortly after delivery (in English, Spanish or Chinese) to determine demographics, reproductive history, and lifestyle sources of toxicant exposures. In addition, she reported her home and work locations in the 4 weeks after 9-11-01. All home and work locations were geocoded and their linear distances from the WTC site were computed. Sample question (for home site, first week): How would you describe the condition of the air outside the place where you were living most during the first week, Sept 11th to 17th? Would you say it was… Not visibly hazy or smoky, and with only occasional or no bad smell………………. =1 Rarely visibly hazy or smoky, with a bad smell during some of the time…………... = 2 Very hazy or smoky only some of the time, but with a bad smell during most of that time…………………………………. = 3 Dense with visible haze or smoke and with a bad smell during a lot of that time…..= 4 As an immediate measure of the women’s exposure at home and work, women were asked to report, for each week at each home and work location, their perception of the average air quality on a 4-point Perceived Air Quality Scale that we developed for this purpose (Figure 1). Average reported values declined over the four weeks. Women’s Perceived Air Quality values were used to develop an areal Model of Air Quality for each of the 4 weeks after 9-11-01. The intent was to develop a Model of Air Quality not highly influenced by individual sensitivity to poor air quality and to determine whether reported air quality can be used to identify populations with high exposure. The Model of Air Quality integrated information on reported air quality for all work and home locations by week, using nearly 1860 perceived air quality values for the 4 weeks, from the women’s 1190 home site reports and 669 work site reports of air quality for those women who were working. The Model was then used to assign to each home and work location for each of 4 weeks, a new, modeled, air quality value. Correlations were computed between the modeled air quality values and the original, reported air quality values and between the reported and modeled values and distance to the WTC site. Figure 2 Figure 3 Results: The Perceived Air Quality Scale is shown in Figure 1. The geographical distribution of the raw air quality values for week 1 reported by the women in the study using this scale is shown in Figure 2. The Model of Air Quality was used to generate the map in Figure 3. This shows the areal distributions of values from the Model of Air Quality for the first week after 9-11-01. Table 1 shows the correlations between the Perceived Air Quality Scale values and Modeled Air Quality values for each of the 4 weeks after 9-11-01 for home and work locations. As expected, modeled and reported air quality are highly correlated. The correlations of reported and modeled values with distance from the WTC site are also shown in Table 1. Table 1. Correlations of modeled and reported air quality values with each other and with distance from the WTC site for 4 weeks after 9-11-01*. Modeled Modeled Modeled Modeled Reported Reported Reported Reported air air air air air air air air wk1 wk2 wk3 wk4 wk1 wk2 wk3 wk4 HOME Reported air wk1………0.654 Reported air wk2………………………0.637 Reported air wk3…...……………………………0.538 Reported air wk4 …………………………………………... 0.565 WORK Reported air wk1 ………0.738 Reported air wk2………………………0.761 Reported air wk3……………………………0.765 Reported air wk4…………………………………………... 0.740 HOME Distance fr WTC wk1……0.893 …………………………………………………0.592 Distance fr WTC wk2…………………0.896 ………………………………………………... 0.587 Distance fr WTC wk3…………………………... 0.848…………………………………………………… 0.489 Distance fr WTC wk4……………………………………... 0.789 ……………………………………………………. 0.492 WORK Distance fr WTC wk1……0.883………………………………………………… 0.670 Distance fr WTC wk2…………………0.896………………………………………………... 0.684 Distance fr WTC wk3 …………………………. 0.901………………………………………………….. 0.704 Distance fr WTC wk4……………………………………...0.889………………………………………………………. 0.710 The data show that that Modeled Air Quality values correlate more strongly with distance from the WTC site than do Perceived Air Quality values. At the time covered by these reports, the WTC collapses, fires and rescue and cleanup operations were a major source of air pollution in the New York area. The high correlation between Modeled Air Quality and distance from the WTC site suggests that the modeling procedure was successful in eliminating variation among reported air quality values due to individual hyper/hypo-sensitivity to air quality. • Conclusion: • These results indicate that reported perception of air quality based on a 4-point scale may be useful for generating models of air quality in other settings where there are insufficient data from standard air pollution detectors. Upcoming Work: A report of the relationship of pregnancy outcomes to the women's work and home locations after 9-11-01 is under peer review. We expect the results to be published shortly.