Demographic Analysis of ESL Student Population at Reston Center: Insights and Recommendations
This report provides a comprehensive demographic analysis of the ESL student population at Reston Center. It includes data preparation of the student database, geocoding based on Northern Virginia’s TIGER files, and an in-depth analysis of demographics such as race, median income, and household size. Key findings indicate that the ideal demographic pattern includes Hispanic and Asian populations with median incomes between $60,001 and $100,000, and average household sizes of 3. Recommendations for improving analysis and database modifications are also provided.


Demographic Analysis of ESL Student Population at Reston Center: Insights and Recommendations
E N D
Presentation Transcript
DEMOGRAPHIC ANALYSIS RESTON CENTER STUDENT POPULATION
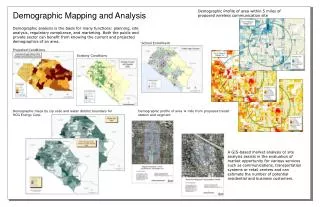
Objectives • Prepare Reston Center’s student database • Geocode on Northern Virginia’s street TIGER files • Analyze the demography of ESL students • Spatially Analyze and identify locations with potential demographic patterns • Recommendations to improve analysis
Reston Center’s student database • Performed address standardization • Extracted VA students • Deleted duplicate records • 526 ESL students record
GEOCODING • Prepared street reference file • US StreetCityState geocoding style • Out of 526 ESL students, 477 geocoded
DEMOGRAPHIC ANALYSIS • RACE • MEDIAN INCOME • HOUSEHOLD SIZE
IDEAL DEMOGRAPHIC PATTERN • Hispanics and Asians between 201-4000 • Median Income between $60,001-$100,000 • Household Size 3
RECOMMENDATIONS • FURTHER ANALYSIS • MEDIAN EDUCATION • AVERAGE DISTANCE TRAVELLED • GIS STUDENTS • VDOT DATA • CHANGES IN STUDENT DATABASE