Download
1 / 7
70 likes | 92 Vues
Explore an automated statistics comparison method for enhanced data accuracy, reducing manual errors and biased results. Realize practical experiences and conclusions for efficient data editing processes. Contact Elmar Wein for more details.

E N D
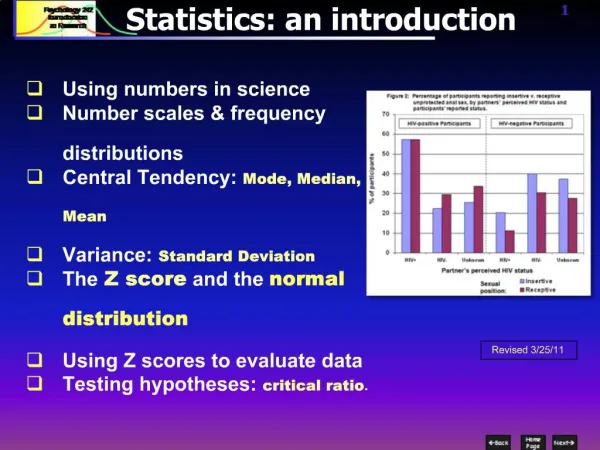
An automated comparison of statistics Introduction Result of the automated comparison Overview of the methodology Realisation and practical experiences Conclusions
Introduction • Signals / soft checks • Suspicious values may be erroneously accepted • Due to scarce resources more and more suspicious values are accepted -> biased statistics • Manual check of actual statistics with respective previous ones outside of the data editing process • Requires … • data transfer and tabulation • extensive experience and subject matter knowledge • No information about inducing records available • Strenuous work that consumes a lot of resources • No guarantee to discover all inconsistencies
Result of the automated comparison Analysis of respective records Comparison of statistics Categorisation of the statistics Euclidean distances of the same checked variables Checked variables per statistic Record identifier Normed weights Relevance indicator Error indicator per statistic Error indicator Flag Flag
Overview of the methodology • Basic idea: Aggregate method • Remove structural effects, influence of the business cycle • Create an actual robust dataset • Principal component analysis (PCA) of the robust actual dataset and the dataset of the previous reporting period • Sum of PC on the basis of the actual dataset and the robust loadings and sum of PC on the basis of the previous data • Statistics: (Weight and) sum up PC, compute differences and flag them on the basis of Nalimov-Test • Records: Euclidean Distances of the sum of PC (error indicator) (and weighting -> relevance indicator), flagging error indicator on the basis of the Nalimov-Test
Realisation and practical experience • Realisation • Pascal Avieny, pascal.avieny@destatis.de • SAS macros with English comments, SAS 9.2, STAT • Requirements: two datasets, identical variables to be compared, ID-variable • Practical experience • Wholesale trade, SBS 2010 versus SBS 2009 • Variables: turnover, gross profit, costs for personnel, value added minus gross profit, working places • Final check at the end of the data editing process • Results • 945 of nearly 12.500 records flagged • Relation between employees and turnover too week • Around 70 records of the ones with the 122 biggest error scores corrected • Review of the relationship between turnover and expansion weight required (now included)
Conclusions • High error indicators corresponded to signals / soft checks that were erroneously confirmed in many cases • Decision on correcting signals / soft checks should be done on the basis of the comparison • Saving resources – even in the case of complex surveys, no automated data editing on one hand and the requirement to disseminate micro data on the other • Methodology • Verification of the high number of flags • Higher hit rate by computing the principal components on the basis of robust covariances? • Use of the dimensional reduction functionality based on PCA
YOU ARE WELCOME! Elmar Wein Telephone: +49/(0) 611 / 75 3128 elmar.wein@destatis.de www.destatis.de