
Abstract
EEG spectral power changes before, during and after obstructive sleep apneas. A. Coito 1 , D. Belo 1 , T. Paiva 2 , J.M. Sanches 1 1 Institute for Systems and Robotics / Instituto Superior Técnico, Lisboa, Portugal

Abstract
E N D
Presentation Transcript
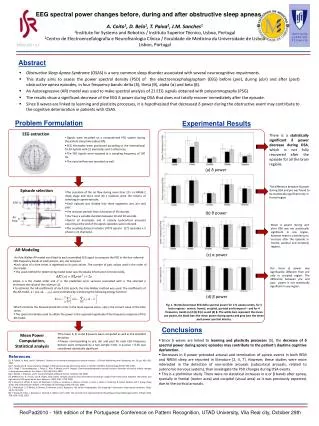
EEG spectral power changes before, during and after obstructive sleep apneas A. Coito1, D. Belo1, T. Paiva2, J.M. Sanches1 1Institute for Systems and Robotics / Instituto Superior Técnico, Lisboa, Portugal 2Centro de Electroencefalografia e Neurofisiologia Clínica / Faculdade de Medicina da Universidade de Lisboa Lisbon, Portugal Abstract • Obstructive Sleep Apnea Syndrome (OSAS) is a very common sleep disorder associated with several neurocognitive impairments. • This study aims to assess the power spectral density (PSD) of the electroencephalographam (EEG) before (pre), during (dur) and after (post) obstructive apnea episodes, in four frequency bands: delta (δ), theta (θ), alpha (α) and beta (β). • An Autoregressive (AR) model was used to make spectral analysis of 21 EEG signals obtained with polysomnography (PSG). • The results show a significant decrease of the EEG δpower during OSA that does not totally recover immediately after the episode. • Since δ waves are linked to learning and plasticity processes, it is hypothesized that decreased δ power during the obstructive event may contribute to the cognitive deterioration in patients with OSAS. Problem Formulation Experimental Results There is a statisticallysignificant δ power decrease during OSA, which is not fully recovered after the episode for all the brain regions. (a) δ power EEG extraction The difference between θpower during OSA and pre was found to be statistically significant only in frontal region. • Signals were recorded on a computerized PSG system during the patient sleep time (about 8h); • EEG electrodes were positioned according to the International 10-20 System with 21 electrodes and 2 references; • The EEG signals were acquired at a sampling frequency of 100 Hz. • The nasal airflow was recorded as well. (b) θ power Mean α power during and after OSA was not statistically significant in any region, however there is a tendency to increase after the episode in frontal, parietal and temporal regions. Episode selection EEG • The cessation of the air flow during more than 10 s in NREM-2 sleep stage and more than 60 s isolation were the criteria of selecting an apnea episode; • Each episode was divided into three segments: pre, dur and post. • Pre and post periods have a duration of 30 seconds. • Dur have a variable duration between 10 and 20 seconds. • Bursts of K-complex and δ activity (subcortical arousals) occurring at the end of the apneic episodes were removed. • The resulting dataset includes 10773 epochs (171 episodes x 3 phases x 21 channels). AR Modeling (c) α power Air Flow • An Yule-Walker AR model was fitted to each assembled EEG signal to compute the PSD in the four referred EEG frequency bands at each period - pre, dur and post. • Each value of a time series is regressed on its past values. The number of past values used is the order of the model. • The used method for determining model order was the Akaike Information Criterion (AIC), Dur mean β power was significantly different from pre only in occipital region. The difference between pre and post power is not statistically significant in any region. • where o is the model order and σ2is the prediction error variance associated with o. The selected o minimizes the value of the criterion [1]. • To estimate the AR coefficients of each EEG epoch, the Yule-Walker method was used. The coefficients of the AR model, a = {a1, a2, ..., ao}, were estimated by minimizing the following energy function: (d) β power Fig. 1- Normalized mean EEG delta spectral power for 171 apnea events, for 5 brain regions - central, frontal, occipital, parietal and temporal – and for 4 frequency bands (a) δ (b) θ (c) α and (d) β. The white bars represent the mean pre power, the black bars the mean power during apnea and grey bars the mean post power spectral density. • Which minimize the forward prediction error in the least-squares sense. y(k) is the current value of the time series. • The spectral estimate used to obtain the power is the squared magnitude of the frequency response of this AR model. Conclusions • The mean δ, θ, α and β powers were computed as well as the standard deviation. • Powers corresponding to pre, dur and post for each EEG frequency domain were compared by a two-sample t-test. A p-value < 0.05 was considered statistically significant. Mean Power Computation, Statistical analysis • Since δ waves are linked to learning and plasticity processes [5], the decrease of δ spectral power during apneic episodes may contribute to the patient’s daytime cognitive dysfunction. • Decreases in δ power preceded arousal and termination of apneic events in both REM and NREM sleep are reported in literature [2, 3, 7]. However, these studies were more interested in the detection of non-visible arousals (subcortical arousals, related to autonomic nervous system), than investigate the PSD changes during OSA events. • This is a preliminar study. There were no statistical increases in α or β bands after apnea, specially in frontal (motor area) and occipital (visual area) as it was previously expected, due to the cortical arousals. References [1] R. Takalo, H. Hytti, and H. Ihalainen. Tutorial on univariate autoregressive spectral analysis. J. Clinical Monitoring and Computing, vol. 19, pp. 401–410, 2005. [2] H. Bandla and D. Gozal. Dynamic changes in EEG spectra during obstructive apnea in children. Pediatric Pulmonology,29:359–365, 2000. [3] K. Dingli, T. Assimakopoulos, I. Fietze, C. Witt, P. Wraith, and N. Douglas. Electroencephalographic spectral analysis: detection of cortical activity changes in sleep apnoea patients. Eur Respir J, 20:1246–1253, 2002. [4] E. Kandel, J. Schwartz, and T. Jessel. Principles of Neural Science. McGraw-Hill, 2000. [5] M.Massimini, G. Tononi, and R. Huber. Slow waves, synaptic plasticity and information processing: insights from transcranial magnetic stimulation and high-density EEG experiments. Eur J Neurosci., 29(9):1761–1770, 2009. [6] V. Somers, D. White, R. Amin, W. Abraham, F. Costa, A. Culebras, S. Daniels, J. Floras, C. Hunt, L. Olson, T. Pickering, R. Russel, M.Woo, and T. Young. Sleep apnea and cardiovascular disease. J Am College of Cardiology, 52(8):313–323, 2008. [7] J. Walsleben, E. O’Malley, K. Bonnet, R. Norman, and D. Rapoport. The utility of topographic EEG mapping in obstructive sleep apnea syndrome. Sleep, 16:76–78, 1993. [8] T. Young, M. Palta, J. Dempsey, J. Skatrud, S. Weber, and S. Badr. The occurrence of sleep-disordered breathing among middle-aged adults. N Engl J Med, 328:1230–1235, 1993. RecPad2010 - 16th edition of the Portuguese Conference on Pattern Recognition, UTAD University, Vila Real city, October 29th


