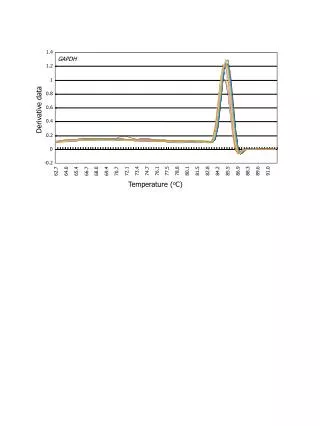
GAPDH
40. B. 30. DMSO. CDDP (10 μ M). Apoptosis (% of Total). TAp73 α. 80 kDa. 20. ∆Np73 α. 70 kDa. P53. ***. 53 kDa. 10. GAPDH. 38 kDa. TAp73 α /GAPDH. 1.0 0.5 0.3 0.8 0.4 0.3 0.2 0.1 0.2 0.1. 0.

GAPDH
E N D
Presentation Transcript
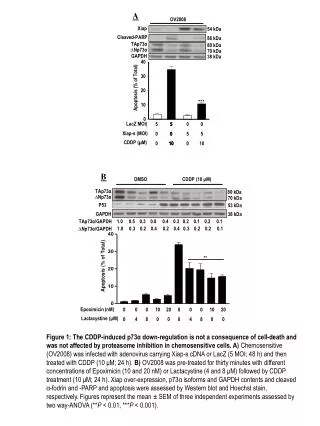
40 B 30 DMSO CDDP (10 μM) Apoptosis (% of Total) TAp73α 80 kDa 20 ∆Np73α 70 kDa P53 *** 53 kDa 10 GAPDH 38 kDa TAp73α/GAPDH 1.0 0.5 0.3 0.8 0.4 0.3 0.2 0.1 0.2 0.1 0 1.0 0.3 0.2 0.4 0.2 0.4 0.3 0.2 0.2 0.1 ∆Np73α/GAPDH Epoximicin (nM) 0 0 0 4 0 8 10 0 20 0 0 0 0 4 0 8 10 0 20 0 Lactacystine (μM) A OV2008 Xiap 54 kDa Cleaved-PARP 86 kDa TAp73α 80 kDa ∆Np73α 70 kDa GAPDH 38 kDa LacZ MOI) 5 0 0 5 0 10 5 0 10 0 5 0 0 5 10 Xiap-s (MOI) CDDP (µM) Figure 1: The CDDP-induced p73α down-regulation is not a consequence of cell-death and was not affected by proteasome inhibition in chemosensitive cells. A)Chemosensitive (OV2008) was infected with adenovirus carrying Xiap-s cDNA or LacZ (5 MOI; 48 h) and then treated with CDDP (10 μM; 24 h). B)OV2008 was pre-treated for thirty minutes with different concentrations of Epoximicin (10 and 20 nM) or Lactacystine (4 and 8 μM) followed by CDDP treatment (10 μM; 24 h). Xiap over-expression, p73α isoforms and GAPDH contents and cleaved α-fodrin and -PARP and apoptosis were assessed by Western blot and Hoechst stain, respectively. Figures represent the mean ± SEM of three independent experiments assessed by two way-ANOVA (**P < 0.01, ***P < 0.001).
40 c c 30 b b Apoptosis (% of total) 20 10 a 0 0 0.5 1 5 10 m 5-Aza Deoxycitidine ( M) A2780s 5-aza-D(µM) 0 0.5 1 2.5 5 10 TAp73α 80 kDa GAPDH 38 kDa Figure 2: The 5-Aza Deoxycitidine, a demethylating agent, restored TAp73α content in chemosensitive (A2780s) cells. A) Chemosensitive (A2780s) cells were treated with different concentrations of 5-Aza Deoxycitidine (0, 0.5, 1, 2.5, 5 and 10 µM; 3 days). TAp73α and GAPDH contents and apoptosis were detected by Western blot and Hoechst stain, respectively. Results were obtained from three independent experiments using one-way ANOVA (Different letters indicate significant differences).
30 *** 20 A2780s+CDDP % of Apoptosis Cell line A2780s A2780cp *** CDDP (10µM) 10 - + - + A2780s 314 bp TAp73α A2780cp 0 ∆Np73α 533 bp A2780cp+CDDP 0 6 12 18 24 β-Actin 629 bp Time (h) A Cell Lines A2780s A2780cp Time (h) 0 6 12 24 0 6 12 24 - - + - + - + - - + - + - + CDDP (10µM) TAp73α∆Np73α 80 kDa 70 kDa 38 kDa GAPDH B Figure 3: TAp73α and ΔNp73α protein (A) and mRNA (B) content in chemosensitive (A2780s) and chemoresistant (A2780cp) cells. Both cells were treated with CDDP (10 µM) and harvested at different time point (0, 6, 12 & 24 h). TAp73α and ΔNp73α mRNA and protein content and apoptosis were detected by RT-PCR, Western blot and Hoechst stain, respectively. Figures indicate the average ± SEM of three independent experiments assessed by two way-ANOVA (***P < 0.001).