Download
1 / 3
30 likes | 232 Vues
16/7/2001 PIDS-Japan. ASIC-LOP/LSTP Roadmap. Assumptions. - Vdd: 1.2V@2001, equals to the HP proposal of USA. But trend is different with each other. - Max. Ig: 100pA/um for LOP (no scaling) 1pA/um for LSTP (no scaling).

E N D
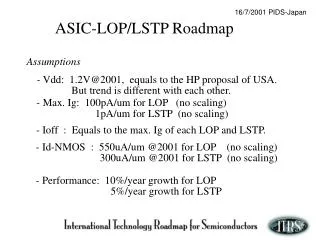
16/7/2001 PIDS-Japan ASIC-LOP/LSTP Roadmap Assumptions - Vdd: 1.2V@2001, equals to the HP proposal of USA. But trend is different with each other. - Max. Ig: 100pA/um for LOP (no scaling) 1pA/um for LSTP (no scaling) - Ioff : Equals to the max. Ig of each LOP and LSTP. - Id-NMOS : 550uA/um @2001 for LOP (no scaling) 300uA/um @2001 for LSTP (no scaling) - Performance: 10%/year growth for LOP 5%/year growth for LSTP
16/7/2001 PIDS-Japan ASIC/LOP, LSTP Roadmap Vdd in MPU(V) 1.2 1.2 1.1 1.0 0.9 0.9 0.8 Vdd in ASIC/L(O)P (V) 1.2 1.2 1.1 1.0 0.9 0.9 0.85 Vdd in ASIC/L(ST)P (V) 1.2 1.2 1.1 1.1 1.0 1.0 0.9 Maximum Ig per Tr 100 100 100 100 100 100 100 (pA/1um) ASIC/L(O)P Maximum Ig per Tr 1 1 1 1 1 1 1 (pA/1um) ASIC/L(ST)P Tox,eq in MPU (nm) 1.4 1.4 1.2 1.0 0.9 0.9 0.8 Tox,eq in ASIC/L(O)P 2.0 1.8 1.6 1.4 1.2 1.1 1.0 (nm) Tox,eq in ASIC/L(ST)P 2.6 2.4 2.2 2.0 1.8 1.6 1.4 (nm) Maximum Ioff at 25C 100 100 100 100 100 100 100 (pA/um) ASIC/L(O)P Maximum Ioff at 25C 1 1 1 1 1 1 1 (pA/um) ASIC/L(ST)P Id-NMOS at Vdd 550 572 529 480 403 427 438 (uA/um) ASIC/L(O)P Id-NMOS at Vdd 402 421 355 292 211 224 198 (uA/um) ASIC/L(ST)P Performance L(O)P 1.0 1.1 1.2 1.3 1.4 1.5 1.6 Performance L(ST)P 1.0 1.1 1.1 1.2 1.2 1.3 1.3 - High-k is put off one year, because of SiON and N/O leakage improvement
ITRS ’01-4-26 PIDS-Japan (Revised) Gate leakage current vs. insulator thickness Limit in MPU SiON 1E 2 N/O SiO2 VLSI ‘01 1E 0 Limit in LOP/ASIC Ta2O5 La2O3 Al2O3 1E-2 Limit in LSTP/ASIC TiO2 VLSI ‘01 1E-4 Gate leakage (A/cm2) HfO2 1E-6 Al2O3 1E-8 @Vg=1V ZrO2 Pr2O3 1E-10 0 1 2 3 Physically effective oxide thickness (nm)