
Analysis of Group E HrcA and Associated Proteins Using Supplemental Figure 1
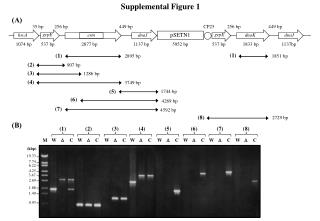
Supplemental Figure 1(A) presents the size distribution of various genomic fragments associated with CP25, pSETN1, and group E hrcA genes. The figure includes detailed sequencing data for specific DNA fragments ranging from 256 bp to 5952 bp. Additionally, it illustrates the molecular weight (M.W.) distribution for other studied compounds in part (B). This comprehensive analysis aids in understanding the genomic architecture and functional attributes of these components. The data can be crucial for future studies examining stress response proteins and gene regulation.

Analysis of Group E HrcA and Associated Proteins Using Supplemental Figure 1
E N D
Presentation Transcript
Supplemental Figure 1 (A) 35 bp 256 bp 449 bp CP25 256 bp 449 bp pSETN1 grpE grpE hrcA erm dnaJ dnaK dnaJ 1074 bp 537 bp 2877 bp 1137 bp 5952 bp 537 bp 1833 bp 1137bp (1) (1) 2895 bp 1851 bp (2) 907 bp (3) 1286 bp (4) 3749 bp (5) 1744 bp (6) 4269 bp (7) 4592 bp (B) (8) 2729 bp (1) (2) (3) (4) (5) (6) (7) (8) M W D C W D C W D C W D C W D C W D C W D C W D C (kbp) 19.33 7.74 6.22 4.25 3.47 2.69 1.88 1.49 0.93