Download
1 / 24
240 likes | 361 Vues
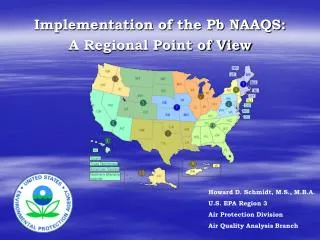
Implementation of the Pb NAAQS:. A Regional Point of View. Howard D. Schmidt, M.S., M.B.A. U.S. EPA Region 3 Air Protection Division Air Quality Analysis Branch. So Much Work… So Little Time. 1.5 m g/m 3. 0.15 m g/m 3. Pb NAAQS Implementation Timing. The Long & Winding Road.

E N D
Implementation of the Pb NAAQS: A Regional Point of View Howard D. Schmidt, M.S., M.B.A. U.S. EPA Region 3 Air Protection Division Air Quality Analysis Branch
The Long & Winding Road • Follow timeline from Final Rule • Emission Inventory – NEI, TRI, ABC, XYZ? • Atmospheric Modeling – Quantity? Location? Source Identification? • Instrumentation – We have to measure for WHAT????? WHERE????? • Lab Analysis – Old methods... Can we tweak ‘em?
January 1, 2010 • Contact with OAQPS • Conduit of information and supply assistance to states & locals • Monthly conference calls
Emission Inventory • Region 3 has not seriously thought about Pb or a Pb network for 10… 20… maybe 30 years?!?!? • 2005 NEI v2??? TRI??? State inventories??? • Clean it up!!! Incorrect emissions & factors, defunct facilities, erroneous geographic information, etc. • Examples
R3 2005 NEI v2 Pb Sources Red: >= 1 tpy Green: 0.5 – 0.99 tpy
R3 2007 State Inventory Pb Sources Red: >= 1 tpy Green: 0.5 – 0.99 tpy
R3 2007 State Inventory Pb Sources with Population Based Monitors Red: >= 1 tpy Green: 0.5 – 0.99 tpy White: MSA > 500,000
Total Maximum R3 Pb Monitors As of 2/24/09
HUGE Discrepancy • 2005 NEI v2 shows a Pb point source in DE with emissions of 4.35 tons per year (tpy) • 2007 DE state inventory shows same Pb point source with emissions of 6 x 10e-7 tpy!!! • What’s going on here?
Resolution? • Emissions Inventory Group at OAQPS received data on a hazardous waste incinerator from the Sector Policies & Programs Division (SPPD) • OAQPS was given no other info than source name, city, and lat / lon • Source was matched to a facility in the NEI based on a lat / lon with minimal significant figures.. BUT, actually belonged to another facility down the road • Source originated in 1992, and similar data continued to be sent to OAQPS from SPPD in 2002, 2005, and 2008 • Verification on current status of incinerator from state + investigation by R3 = correction in 2005 NEI v2 by OAQPS
2005 v 2007 PbInventory Issues • Neglected to include a 98% efficiency baghouse • Changed grinding media from metal to non-leaded • Consultant error – doubled emissions • Former employee miscalculation • Three cogen facilities used emission factor for uncontrolled pulverized coal – rather than controlled • Company reported a transcription error • Material previously being sandblasted now has less lead due to changes in paint formulation
Atmospheric Modeling • Used to determine the effects of nearby Pb sources… each < 1 tpy • May show sources < 1 tpy are exceeding NAAQS due to unique geography, source characteristics, etc. • RA can grant waivers for sources >= 1 tpy if impacts estimated to be 0.075 mg/m3 or less
Pb-TSP Samplers • Appendix B to 40 CFR Part 50 • Concentration & particle size ranges • Precision & accuracy • Error (flow, volume, sample loss, foreign matter, humidity, timer, etc.) • Quantity – how many do we have/need? • Condition – field ready or not? • Rehab – can we fix them? • Purchase – from who for how much?
We Have Samples… Now What? • Laboratories – Who will analyze? State, Regional, Private • Capacity / Manpower • FRM – Appendix G to 40 CFR Part 50 • FEMs, there are 21, so, what’s the problem? • Cost
Questions ? ? ?