
Introduction
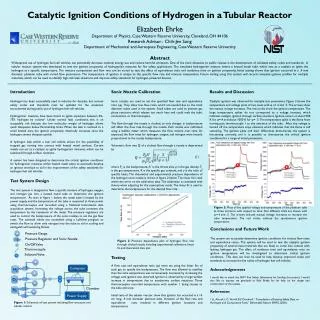
Pressure Gauge. Pressure Regulator and Sonic Nozzle. On/Off Valve. H 2. O 2. N 2. Catalytic Ignition Conditions of Hydrogen in a Tubular Reactor. Thermocouple. Solenoid Valve. Elizabeth Ehrke Department of Physics, Case Western Reserve University, Cleveland, OH 44106

Introduction
E N D
Presentation Transcript
Pressure Gauge Pressure Regulator and Sonic Nozzle On/Off Valve H2 O2 N2 Catalytic Ignition Conditions of Hydrogen in a Tubular Reactor Thermocouple Solenoid Valve Elizabeth Ehrke Department of Physics, Case Western Reserve University, Cleveland, OH 44106 Research Advisor: Chih-Jen Sung Department of Mechanical and Aerospace Engineering, Case Western Reserve University Chamber Computer Power Supply Abstract Widespread use of hydrogen fuel cell vehicles can potentially decrease national energy use and reduce harmful emissions. One of the main obstacles to public release is the development of validated safety codes and standards. A tubular reactor system was developed to test the ignition propensity of hydrogen/air mixtures for fire safety applications. The simulated hydrogen/air mixture enters a heated metal tube, which acts as a catalyst to ignite the hydrogen at a specific temperature. The mixture composition and flow rate can be varied to test the affect of equivalence ratio and residence time on ignition propensity. Initial testing shows that ignition occurred in a .4 mm diameter platinum tube with varied flow parameters. The temperature of ignition is unique to the specific flow rate and mixture composition. Future testing using this system will record complete ignition profiles for multiple materials, which can be used to identify high-risk leak situations and improve safety standards for hydrogen-powered devices. Introduction Hydrogen has been successfully used in industry for decades, but current safety codes and standards must be updated for the situations encountered during public use of hydrogen fuel cell vehicles. Hydrogen/air mixtures have been found to ignite anywhere between 4%-75% hydrogenby volume1. Under normal leak conditions, this is an acceptable risk because the low molecular weight of hydrogen allows quick dissipation below flammability limits. When the leak is confined to a small heated area, the ignition propensity drastically increases since the hydrogen cannot dissipate quickly. A hydrogen leak within a fuel cell vehicle allows for the possibility of trapped gas coming into contact with heated metal surfaces. Certain metals can act as a catalyst to ignite hydrogen/air mixtures, which can be sustained through surface reactions. A system has been designed to determine the critical ignition conditions for hydrogen/air mixtures within heated metal tubes to eventually develop an ignition envelope to aid in the improvement of fire safety standards for hydrogen fuel cell vehicles. Test System Design The test system is designed to flow a specific mixture of hydrogen, oxygen, and nitrogen gas into a heated metal tube to determine the ignition temperature. As seen in figure 1 below, the metal tube is heated by the power supply, and the temperature of the tube is measured at three points using thermocouples and recorded using a National Instruments data acquisition system. Increasing the voltage across the tube increases the temperature by the resistance of the metal. The pressure regulators are used to control the backpressure of the sonic nozzles to set the gas flow rates. The solenoid valves are controlled using a LabView program to switch the flow to allow only nitrogen into the tube to aid in cooling and extinguish self sustaining flames. Sonic Nozzle Calibration Sonic nozzles are used to set the specified flow rate and equivalence ratio (ϕ). They allow low flow rates, which are needed due to the small diameter tubes used in the system. Small tubes are used to prevent gas phase reactions, which release too much heat and could melt the tube, connections, or thermocouples. The flow through the nozzle is choked, so only changes in backpressure will affect the flow rate through the nozzle. Each nozzle was calibrated using a bubble meter which measures the flow volume over time. As expected, the flow rates for hydrogen, oxygen, and nitrogen were linearly proportional to the nozzle backpressure. Volumetric flow rate Q of a choked flow through a nozzle is determined by (1) where Po is the backpressure, A* is the throat area, ρ is the gas density, To is the gas temperature, R is the specific gas constant, and γ is the ratio of specific heats. The theoretical and experimental pressure dependence of the hydrogen sonic nozzle is shown in figure 2 below. The linear fit is well within the error on the calibration data. The calibration is consistent with theory when adjusting for the assumptions made. The linear fit is used to determine the backpressure for the desired flow rate. Results and Discussion Catalytic ignition was observed for multiple test parameters. Figure 3 shows the temperature and voltage plots of two tests with ϕ of .4 and .5. The arrows show the manual voltage increases. The red circles show the ignition temperature. The large temperature spikes do not correspond to a voltage increase, which indicates catalytic ignition through surface reactions. Ignition occurs at about 900 K for ϕ=.4 and about 1000 K for ϕ=.5. The temperature spike is the flame front moving past thermocouple 1 to the entrance of the tube. After the voltage is turned off the temperature stays elevated, which indicates that the flame is self sustaining. The ignition plots and their differences demonstrate the system is functioning correctly, and it is possible to characterize the critical ignition conditions for a range of initial parameters. Figure 3: Plots of the applied voltage and temperature of the platinum tube at three locations with respect to time. Two different trials are shown with ϕ=.4 and .5. The arrows indicate manual voltage increases to increase the tube temperature. The red circles indicate the spontaneous ignition temperature. • Conclusions and Future Work • The system can accurately determine ignition conditions for various flow rates and equivalence ratios. This system will be used to test the catalytic ignition propensity of several metal materials that are likely to come into contact with leaking hydrogen gas. The affect of residence time and equivalence ratio on ignition temperature will be investigated to determine critical ignition conditions. This data can then be used to help develop improved codes and standards to increase the fire safety of hydrogen fuel cell vehicles. • Acknowledgements • I would like to thank the NIST Fire Safety Laboratory for funding this project. I would also like to express my gratitude to Kyle Brady for his help on the design and construction of the system. • References • J.L. Alcock, L.C. Shirvill, R.F. Cracknell, “ Compilation of Existing Safety Data on Hydrogen and Comparative Fuels,” Deliverable Report EIHP2, (2001) Figure 2: Pressure dependence plot of hydrogen flow rate through choked nozzle including experimental calibration, linear fit, and theoretical data plot Testing A flow rate and equivalence ratio (ϕ) were set using the linear fits of each gas to specify the backpressure. The flow was allowed to stabilize then the tube temperature was incrementally increased by increasing the voltage until ignition was observed. Ignition is observed by a large sudden increase in temperature due to exothermic surface reactions. Three thermocouples recorded temperature with number 1 being closest to the tube entrance. Initial tests of the tubular reactor show that ignition has occurred in a 14 cm long, .4 mm diameter platinum tube. Variation of the flow rate and equivalence ratio resulted in different ignition locations and temperatures. Figure 1: Schematic of test system including flow structure and tubular reactor


