Motion Picture Industry
Motion Picture Industry. Presented By Kathy O’Brien Shaun Ryan Matthew Dvorchak. Loews Cineplex Entertainment (LCP). Background Information.


Motion Picture Industry
E N D
Presentation Transcript
Motion Picture Industry Presented By Kathy O’Brien Shaun Ryan Matthew Dvorchak
Background Information Loews Cineplex Entertainment Corp. is major motion picture theatre exhibition company with operations in North America and Canada. The Company operates 2,926 screens at 385 theatres in 22 states, the District of Columbia and 6 Canadian provinces. For the 6 months ended 8/31/00, total revenues fell 7% to $470.3M. Net loss totaled $87M, up from $6M. Results reflect a decline in attendance levels and increased losses on the sale of theatres.
Price & Volume Recent Price $0.56 52 Week High $6.50 52 Week Low $0.56 Avg Daily Vol (Mil) 0.03 Beta 1.14 Share Related Items Mkt. Cap. (Mil) $33.01 Shares Out (Mil) 58.62 Float (Mil) 6.40 Dividend Information Yield % 0.00 Annual Dividend 0.00 Payout Ratio (TTM) % 0.00 Financial Strength Quick Ratio (MRQ) 0.09 Current Ratio (MRQ) 0.10 LT Debt/Equity (MRQ) 0.69 Total Debt/Equity (MRQ) 1.94 Key Ratios and Statistics
Valuation Ratios Price/Earnings (TTM) NM Price/Sales (TTM) 0.04 Price/Book (MRQ) 0.06 Price/Cash Flow (TTM) NM Per Share Data Earnings (TTM) $-2.26 Sales (TTM) $15.28 Book Value (MRQ) $9.04 Cash Flow (TTM) $-0.20 Cash (MRQ) $0.93 Mgmt Effectiveness Return on Equity (TTM) –21.86 Return on Assets (TTM) –6.98 Return on Investment (TTM) –8.51 Profitability Gross Margin (TTM) % 15.10 Operating Margin (TTM) % -5.16 Profit Margin (TTM) % -14.78 Key Ratios and Statistics
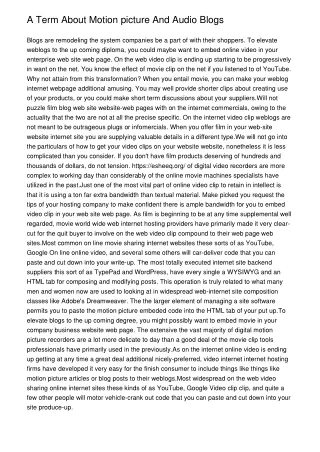
Stock Chart and Key Numbers • Fiscal Year-End: February • 2000 Sales (mil.): $930.4 • 1-Yr. Sales Growth: 9.3% • 2000 Net Inc. (mil.): ($51.4) • 2000 Employees: 16,300 • 1-Yr. Employee Growth: 1.9%
Carmike Cinemas Company Information
2000 First Quarter Report • Revenue increased from $97.7 million to. $101.5 million • Increase in admission and concession revenue. • Per share loss for the quarter was $.72. • Quarter was negatively impacted by the number of new theaters opened in 1999 and high operating costs. • Carmike is the third largest motion picture company in the country.
Results for Second Quarter 2000 • Revenue was $112.7 million in 2000 down from $125.3 million in 1999. • Carmike filed petitions with the U.S. Bankruptcy Court for the District of Delaware. • Carmike had received approval to reject leases relating to 65 theater locations. • Box office admissions and costs of operations were both down from 1999
Theater Report • Carmike currently operates 438 theaters. • New seating is built to accommodate 40,000 customers a year. • 88 new screens are to be opened in 2000
Valuation Ratios Price/Earnings(TTM)NM Price/Sales(TTM).01 Price/Book(MRQ).03 Price/Cash Flow(TTM)NM Per share Data Earnings(TTM)$-6.57 Sales(TTM)$40.64 Book Value(MRQ)$13.39 Cash Flow(TTM)$-2.57 Cash(MRQ)$5.31 Mgmt Effectiveness Return On Equity(TTM)-39.90 Return On Assets(TTM)-8.92 Return On Investments(TTM)-11.00 Profitability Gross Margin(TTM)%13.59 Operating Margin(TTM)%-4.45 Profit Margin(TTM)%-15.67
BACKGROUND INFORMATION • AMC is one of largest motion picture corporations in the world. It opened its doors in 1920. They were the creator of the first cupholder armrests, automated tickets, and the multi-theatre megaplex. They recently created MovieTickets.com. You can purchase your tickets online. Edward and Stan Durwood creators Worldwide they have 211 theatres with 2,903 screens in 22 states.
STRENGTHS - AMC remains the leader in North American box office market share. For FY 2000, AMC held 9.8 percent of the North American box office - rising to a 10 percent share in the fourth quarter. - AMC's ratio of 13.8 screens per theatre is the highest in the industry - a clear indication of ongoing leadership in the megaplex transition. - On the basis of attendance per screen, AMC's theatres are the most productive in the industry. The AMC domestic circuit generated average annual attendance of 55,800 per screen last year, compared with 39,400 for the exhibition industry as a whole. - AMC had by far the industry's highest percentage of top-grossing theatres. Of North America's top 50 highest-grossing theatres, 22 were AMC theatres, compared to seven theatres for the next-closest competitor.
STOCK INFORMATION AMC Entertainment Inc. Common Stock trades on the American Stock Exchange under the symbol AEN. Quarterly Common Stock Price Range Fiscal 2000 Fiscal1999 High Low High Low First Quarter $19^1/4 $14 $23^3/4 $16^13/16 Second Quarter 19 12^3/16 19^7/8 11^1/4 Third Quarter 13^15/16 8^9/16 21^1/16 10^3/4 Fourth Quarter 11^5/16 5 20^3/16 13^9/16 Year 19^1/4 5 23^3/4 10^3/4
STOCK INFORMATION AMC Entertainment Inc. Common Stock trades on the American Stock Exchange under the symbol AEN. Quarterly Common Stock Price Range Fiscal 2000 Fiscal1999 High Low High Low First Quarter $19^1/4 $14 $23^3/4 $16^13/16 Second Quarter 19 12^3/16 19^7/8 11^1/4 Third Quarter 13^15/16 8^9/16 21^1/16 10^3/4 Fourth Quarter 11^5/16 5 20^3/16 13^9/16 Year 19^1/4 5 23^3/4 10^3/4
IMPORTANT NUMBERS As of March 30, 2000 Total revenues $ 1,166,942 Adjusted EBITBA $117,620 Attendance 154,686 *# of theatres operated 211 * = only number to go down since March 28, 1996
COMPANY COMPARISON • Here we will compare the three companies to determine which is the most successful.
Return on Assets(TTM)-AMC had the highest return at –5.33, LOEWS –6.98, and CARMIKE was the worst by far at –8.91 Return on Equity(TTM)-AMC – 94.98 , LOEWS –21.86, and CARMIKE –38.15 Total Debt/Equity(MRQ)- AMC was 27.66, LOEWS 1.94, and CARMIKE 1.63. Quick Ratio(MRQ)- AMC’s quick was .48, LOEWS was .09, and CARMIKE had a quick ratio of .13 KEY STATISTICS/RATIOS
CONCLUSION • In conclusion we have found that Carmike Cinemas is, as of right now, the least successful of the three. Carmike has filed petitions for bankruptcy. AMC is the most successful company. They have the highest ratio of screens per theater and on the basis of attendance per screen, the AMC theaters are the most productive in the industry. Out of the top 50 highest-grossing theaters in the North, 22 of them belonged to AMC. Loews Cineplex is ranked second of the three. Although the company was better off than Carmike, results in for 2000 show that their revenues have fallen, attendance levels have decreased and there has been an increased loss on the sale of theaters.