
Understanding Regression Analysis in Data Modeling
Learn how to best approximate data using regression analysis, plot regression lines, calculate errors, and interpret correlation coefficients. Discover key concepts like collinearity and how to avoid misinterpretations. Master regression for data analysis.

Understanding Regression Analysis in Data Modeling
E N D
Presentation Transcript
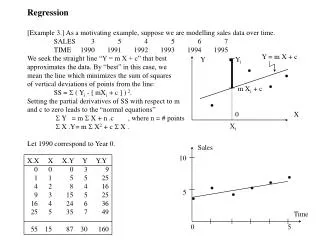
Regression[Example 3.] As a motivating example, suppose we are modelling sales data over time. SALES 3 5 4 5 6 7 TIME 1990 1991 1992 1993 1994 1995We seek the straight line “Y = m X + c” that best approximates the data. By “best” in this case, we mean the line which minimizes the sum of squaresof vertical deviations of points from the line: SS = S ( Yi - [ mXi + c ] ) 2.Setting the partial derivatives of SS with respect to m and c to zero leads to the “normal equations” S Y = m S X + n .c , where n = # pointsS X .Y= m S X2 + c S X .Let 1990 correspond to Year 0.X.X X X.Y Y Y.Y 0 0 0 3 9 1 1 5 5 25 4 2 8 4 16 9 3 15 5 25 16 4 24 6 36 25 5 35 7 49 55 15 87 30 160 Y = m X + c Y Yi m Xi + c 0 X Xi Sales 10 5 Time 0 5
Example 3 - Workings.The normal equations are: 30 = 15 m + 6 c => 150 = 75 m + 30 c 87 = 55 m + 15 c 174 = 110 m + 30 c=> 24 = 35 m => 30 = 15 (24 / 35) + 6 c => c = 23/7Thus the regression line of Y on X is Y = (24/35) X + (23/7)and to plot the line we need two points, so X = 0 => Y = 23/7 and X = 5 => Y = (24/35) 5 + 23/7 = 47/7. It is easy to see that ( X, Y ) satisfies the normal equations, so that the regression line of Y on X passes through the “Center of Gravity” of the data. By expanding terms, we also getS( Yi - Y ) 2 = S ( Yi - [ m Xi + c ] ) 2+ S ( [ m Xi + c ] - Y ) 2Total Sum ErrorSum Regression Sumof Squares of Squares of SquaresSST = SSE + SSRIn regression, we refer to the X variable as the independentvariable and Y as the dependent variable. Y Yi mXi +C Y Y X X
CorrelationThe coefficient of determination r2 ( which takes values in the range 0 to 1) is a measure of the proportion of the total variation that is associated with the regression process: r2 = SSR/ SST = 1 - SSE / SST.The coefficient of correlation r ( which takes values in the range -1 to +1 ) is more commonly used as a measure of the degree to which a mathematical relationship exists between X and Y. It can be calculated from the formula: r = S ( X - X ) ( Y - Y )ÖS ( X - X )2 ( Y - Y ) 2 = n S X Y - S X S YÖ{ nSX 2 - ( S X ) 2 } { nSY 2 - ( S Y ) 2 }Example. In our case r = {6(87) - (15)(30)}/ Ö{ 6(55) - (15)2 } { 6(160) - (30)2 } = 0.907. r = - 1 r = 0 r = + 1
CollinearityIf the value of the correlation coefficient is greater than 0.9 or less than - 0.9, we would take this to mean that there is a mathematical relationship between the variables. This does not imply that a cause-and-effect relationship exists.Consider a country with a slowly changing population size, where a certain political party retains a relatively stable percentage of the poll in elections. Let X = Number of people that vote for the party in an election Y = Number of people that die due to a given disease in a year Z = Population size.Then, the correlation coefficient between X and Y is likely to be close to 1, indicating that there is a mathematical relationship between them (i.e.) X is a function of Z and Y is a function of Z also. It would clearly be silly to suggest that the incidence of the disease is caused by the number of people that vote for the given political party. This is known as the problem of collinearity. Spotting hidden dependencies between distributions can be difficult. Statistical experimentation can only be used to disprove hypotheses, or to lend evidence to support the view that reputed relationships between variables may be valid. Thus, the fact that we observe a high correlation coefficient between deaths due to heart failure in a given year with the number of cigarettes consumed twenty years earlier does not establish a cause-and-effect relationship. However, this result may be of value in directing biological research in a particular direction.