Linköping University
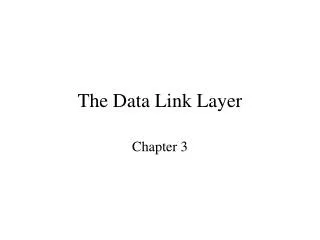
Linköping University. Sören Sjöström IEI, Solid Mechanics. High-cycle fatigue (HCF) Railway accidents and the Wöhler test. Catastrophe ferroviaire de Meudon (entre Versailles et Paris), 8 mai 1945 . Entgleisung 19.Oktober 1875, Bahnhof Timelkam ( zwischen Linz und Salzburg ).


Linköping University
E N D
Presentation Transcript
Linköping University Sören Sjöström IEI, Solid Mechanics
High-cyclefatigue (HCF) Railway accidents and the Wöhler test Catastrophe ferroviaire de Meudon (entre Versailles et Paris), 8 mai 1945 Entgleisung 19.Oktober 1875, Bahnhof Timelkam (zwischen Linz und Salzburg) Mystery: Wheels and axlescompletelycorrectly designed staticallydesigned
Fatigue: Wöhler test German railwayengineer August Wöhler 1819-1914 Roller bearing sa s(t) at a fixedpoint on the surface t -sa F
sa or log sa Fatigue: Wöhler diagram LCF region HCF region Fatigue limit 3 4 5 6 7 sa logNf t -sa
Fatigue: Wöhler diagram, continued Othername: S-N diagram sa or log sa Increasingsm Fatigue limit sa 3 4 5 6 7 logNf t sa sm -sa -sa t
Haigh diagram sa sY (sFLP,sFLP) =(sup,sup) sFL=su sa sa sm -sa t t sY sUTS=sB sm Allowed region -sa
HCF (High-cycleFatigue) The Haigh diagram has been set up by standardised testing using a standardised test specimen, for instance: Polished In most data tables, a specimen diameter of 10 mm has beenused
I. Surface roughness Roughsurfaces are moredangerous in fatiguethansmoothsurfaces Iffatigue data havebeenmeasured on ideallysmooth (polished) specimens, howcanweusethem for a not so ideallysmooth specimen? sa Reduction! sFL=su (sFLP,sFLP) =(sup,sup) k·su (sup,k·sup) sUTS=sB sm
Surface roughness, cont. In this example, (a) polished surface (b) groundsurface (c) machinedsurface (d) ’notch’ (e) hot-rolledsurface (f) corrosion in tap water (g) corrosion in salt water (all are for steel materials) • Note that: • Fatigueproperties are dramaticallyworsened under corrosiveconditions [(f) and (g)] • The highertensilestrength the steel has, the more sensitive it is to surfaceconditions • A bad surfacecan be verydestructive
II. Loadedvolume The risk of failure for a given loadincreases with the amount of material loaded (Weibull statistics – the largervolume of material is loaded, the morelikely is it that a fatally bad material pointexists) Again, if the actualcaseloads a different volumethan the standardised test specimen, we must thereforereduce the Haigh diagram. sa sFL=su (sFLP,sFLP) =(sup,sup) d·su (sup,d·sup) sUTS=sB sm
Loadedvolume, cont. (a) sUTS= 1500 Mpa (b)sUTS= 1000 MPa (c)sUTS= 600 MPa (d)sUTS= 400 MPa Steel with (e)aluminium alloy Note: this effect is usually less than that of surfacecondition
III. Stress concentrations Ifthereexists a local region of raisedstress,this region is of coursedangerous from the point of view of fatigue. The maximum stress in such a region can be computed by usingstress concentrationfactorKtdiagrams. One example is shown in the figure
Stress concentrations, cont. The same reasoning as beforeaboutvolumes and statistical risks can be applied. Since the volumehaving high stress is small, weneed not take the full stress concentrationfactorKtintoaccount; insteadwedefine a fatiguestrengthreductionfactor q = notchsensitivityfactor; depends on the notchradius and the tensilestrength of the material
Stress concentrations, continued In the diagram to the left, all curves are for steel. (a)sUTS = 1600 Mpa (b)sUTS = 1300 Mpa (c)sUTS = 1000 Mpa (d)sUTS = 700 Mpa (e)sUTS = 400 Mpa Noteagain that highersUTS⇒ higherq ⇒ highersensitivity to high stresses in notches
Stress concentrations, cont. Kt and Kf are nowused for increasing the nominal stress state: Nominal: To be carriedinto the reducedHaigh diagram ⇒ Increased: sa sFL=su (sFLP,sFLP) = (sup,sup) (Ktsm,Kfsa) (sm,sa) sUTS=sB sm
Further, oneusuallydoesnot allowloadsabove the yieldstrength. I.e., the linecorresponding to is alsoentered in the Haigh diagram: sa Y su (Ktsm,Kfsa) (sup,sup) (sm,sa) sUTS=sB sm Y Finallyallowed stress states
Safetyagainstfatigue Study the loadpoint P (Ktsm, Kfsa). Draw a straight line OC’ from the originthrough the loadpoint to the Intersection with the limit of the allowed region. Define ’allowedlength’/’usedlength’ as safetyfactor: sa su (sup,sup) C’ P O sB sm
Safetyagainstfatigue Study the loadpoint P (Ktsm, Kfsa). Alternatively: Draw a straight line DB’ from the saaxisthrough the load point to the intersection with the limit of the allowed region. Define ’allowedlength’/’usedlength’ as safetyfactor: sa su (sup,sup) B’ D P O sm sUTS=sB
Safetyagainstfatigue Study the loadpoint P (Ktsm, Kfsa). Another alternative: Draw a verticalline AA’ from the originthrough the load point to the intersection with the limit of the allowed region. Define ’allowedlength’/’usedlength’ as safetyfactor: sa su (sup,sup) A’ P O A sm sUTS=sB
Further, oneusuallydoesnot allowloadsabove the yieldstrength. I.e., the linecorresponding to is alsoentered in the Haigh diagram: sa Y su (Ktsm,Kfsa) (sup,sup) (sm,sa) sUTS=sB sm Y Finallyallowed stress states
III. Stress concentrations Ifthereexists a local region of raisedstress,this region is of coursedangerous from the point of view of fatigue. The maximum stress in such a region can be computed by usingstress concentrationfactorKtdiagrams. One example is shown in the figure
Haigh diagram sa sY sFL=su (sFLP,sFLP) =(sup,sup) sY sUTS=sB sm Allowed region
The same reasoning as beforeaboutvolumes and statistical risks can be applied. Thus, weneed not take the full stress concentrationfactorKtintoaccount; insteadwedefine a fatiguestrengthreductionfactor where the notchsensitivityfactorqdepends on the notchradius and the tensilestrength of the material
Or, shown in anotherway: Large deformation Fracture (static or fatigue) Instability
Different failuretypes Plastic flow Large deformation Creep Fracture Toolarge stress Staticfracture Fatiguefracture Instability
History of a fatiguefailure • - Initiation of a small crack • - Growth of the crack • - Final fracture
Fatigue: Wöhler diagram, continued Othername: S-N diagram sa or log sa Increasingsm Fatigue limit sa 3 4 5 6 7 logNf t sa sm -sa -sa t
sa or log sa Fatigue: Wöhler diagram Fatigue limit 3 4 5 6 7 sa logNf t -sa
History of a fatiguefailure: Aloha Airlines’ flight No. 243, 28th April , 1988 X X X 13:48 13:55 13:47 13:25
Examples of fatiguefailure Aloha Airlines Boeing 737 ’convertible’ (28th April, 1988)
MARKERINGSYTA FÖR BILDER När du gör egna slides, placera bilder och andra illustrationer inom dessa fält. Titta gärna i ”baspresentationen” för exempel på hur placeringen kan göras.