Tutorial on Tukey Charts
Tutorial on Tukey Charts. Farrokh Alemi, Ph.D. Sunday, 11/25/2007. Why Chart Data?. To discipline intuitions Only points outside the limit are real changes To communicate data in vivid graphical ways. Steps in Creating a Chart. Check assumptions & select time period


Tutorial on Tukey Charts
E N D
Presentation Transcript
Tutorial on Tukey Charts Farrokh Alemi, Ph.D. Sunday, 11/25/2007
Why Chart Data? • To discipline intuitions • Only points outside the limit are real changes • To communicate data in vivid graphical ways
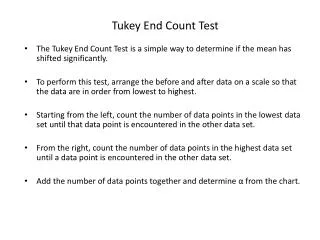
Steps in Creating a Chart • Check assumptions & select time period • Calculate Median and Fourths • Calculate Fourth Spread • Calculate control limits • Plot observations and control limits • Interpret findings • Distribute control chart
Step 1: Check Assumptions • Observations must be measured on an interval scale. • There must be at least 7 observations in the time period where control limits are calculated
Step 2: Calculating Limits UCL = Upper Fourth + 1.5 * Fourth Spreads LCL = Lower Fourth – 1.5 * Fourth Spreads Upper Fourth is value where ¼ of data above it Lower Fourth is value where ¼ of data below it Fourth Spread is difference of Upper and Lower Fourths
Calculating Median • Median is a value where 50% of data are below if and & 50% above it. • List observations from smallest to largest • If odd number of observations, take the data point in the middle, where 50% of data are below it. • If even number of observations, take average of the two middle ranked numbers.
Calculating Limits by Using Median • List values from smallest to largest • Calculate median, divide the data into two halves If Median is one of the data points, include it in both the upper and lower half of data • Lower Fourth is the Median of lower half of data • Upper Fourth is the median of the upper half of the data • Fourth Spread is the difference between the two Fourths • Calculate limits as: LCL = Lower Fourth - 1.5 * Fourth Spread UCL = Upper Fourth + 1.5 *Fourth Spread No need for Calculator
Pre-intervention Example: Exercise Data
Analysis of Exercise Data: Step 1 Lower half of data Upper half of data Two halves both include Median because it is an observed data point Median
Analysis of Exercise Data: Step 2 Lower Fourth is Median of lower data set, it is a value between 25 & 30, so it is 27.5
Upper Fourth is Median of upper data set, it is a value between 35 & 40, so it is 37.5 Analysis of Exercise Data: Step 3
Analysis of Exercise Data: Step 4 • Fourth Spread = 37.5-27.5 = 10 • UCL = 37.5+1.5*10 = 52.5 Upper Fourth Fourth Spread
Analysis of Exercise Data: Step 4 • Fourth Spread = 37.5-27.5 = 10 • LCL = 27.5-1.5*10 = 12.5 Lower Fourth Fourth Spread
Sort the data from lowest to highest value Analysis of Budget Data: Step 1
Median Analysis of Budget Data Continued Lower Fourth is Median of lower half and is -4.5 Lower half Fourth spread is 23.5 minus -4.5 = 29 Upper Fourth is Median of upper half and is 23.5 Upper Half UCL is 23.5 + 1.5 * 29 LCL is -4.5 - 1.5* 29
Take Home Message Tukey Chart can work with small number of data points with no assumptions regarding data distribution