Download
1 / 19
190 likes | 210 Vues
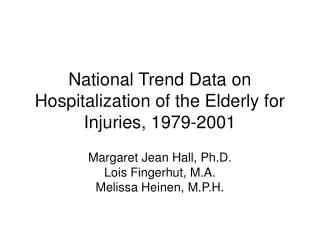
National Trend Data on Hospitalization of the Elderly for Injuries, 1979-2001. Margaret Jean Hall, Ph.D. Lois Fingerhut, M.A. Melissa Heinen, M.P.H. Study Objectives – to analyze trend data on elderly injury hospitalizations and to identify ways to decrease injuries in the future.

E N D
National Trend Data on Hospitalization of the Elderly for Injuries, 1979-2001 Margaret Jean Hall, Ph.D. Lois Fingerhut, M.A. Melissa Heinen, M.P.H.
Study Objectives – to analyze trend data on elderly injury hospitalizations and to identify ways to decrease injuries in the future.
Data from the National Hospital Discharge Survey- Based on a sample of non-federal short-stay hospitals- Abstracted from the medical records of a sample of inpatients- Data for 1979-2001 for about 450 hospitals and 300,000 discharges per year- Weighted to produce national estimates
Injury defined byInternational Classification of Disease Codes (ICD-9-CM) 800-909.2, 909.4, 909.9, 910-994.9, 995.5-995.59, 995.80-995.85 Definition developed by the State and Territorial Injury Prevention Directors’ Association (STIPDA)
Trends in injury hospitalization by age 65 and over 45-64 15-44 < 15 1979 2001 Elderly injury hospitalization rates were higher and did not decrease as much as rates for younger patients.
Injury hospital patients under and over age 65 % The proportion of injury hospital patients who are elderly has been increasing.
Elderly injury hospitalization 19792001 # of discharges 593,000 717,000 Rate per 10,000 population 235.9 202.8 % of total elderly hospitalizations 7% 6%
Type of injury resulting in elderly hospitalization Other injuries Poisoning Internal injuries Fractures Most of the elderly injury hospitalizations were for fractures. The share of injury hospitalizations for fractures increased over time.
Injury hospital discharge rates by sex for those 65 and over females males 1979 2001 Elderly females had higher injury hospital discharge rates than elderly males.
Fracture hospitalization rates by sex for the elderly females males 1979 2001 Elderly females have higher fracture hospitalization rates than males. Both male and female fracture hospitalization rates for the elderly remained stable over time.
Hip fracture hospital discharge rate for females 65 and over 85 and over 75-84 65-74 2001 1979 Females 85 and over had the highest discharge rate for hip fractures and this rate increased over time.
Elderly injury patients with and without external cause codes Percent No external cause code 35% 51% 73% 90% With at least one external cause code External cause coding increasing but still missing for more than a third of the elderly injury patients.
Hospitalized elderly injury patients with no external cause codes, 2001 Had no room on abstract form for E-code Had room for E-codes on abstract form 45% 55%
External cause of injury data for elderly injury hospitalizations, 2001 No external cause 35% Falls 49% Other external causes 11% 3% 2% Motor vehicle traffic Poisoning Falls were cause of almost half of elderly injury hospitalizations.
External cause of injury data for fracture hospitalizations for the elderly, 2001 No external cause 35% Falls 55% Other external causes 8% Motor vehicle traffic 2% Falls were cause of more than half of elderly fracture hospitalizations.
Reasons why elderly are at higher risk of injury hospitalization Longer lives may bring more frailty or cognitive impairment Illness or medications can cause dizziness or unsteadiness Slower response times, including while driving, can increase accident risk Safety hazards often exist in homes When elderly are in an accident there is a greater likelihood of being seriously hurt
What can be done? Complete health assessment and coordinated medical care, including vision checks, on a regular basis Medication monitoring including dosage, side effects and drug interactions Screening for osteoporosis in middle age to halt or even reverse bone damage Weight-training and other exercise programs, such as tai chi, to keep older adults stronger and improve their gait Improve the appearance and comfort of hip pads to prevent injury from falls, and identify ways to increase compliance with their use
What can be done? Increase home safety by improving lighting, installing handrails on steps and in bathtubs, and eliminating other dangerous situations Transportation Conduct safe driver programs geared to the elderly Teach physicians and family members how to assess whether an elderly person should continue to drive Offer alternative forms of transportation for the elderly who don’t drive
Source of additional injury data:Trends in Injury Hospitalizations: United States, 1979-2001published byThe National Center for Health Statistics, CDChttp://www.cdc.gov/nchs/injury.htm