Role of microRNA-1 and microRNA-133a in Inhibiting Prostate Cancer Progression via PNP Regulation
This study investigates the expression of microRNAs miR-1 and miR-133a in prostate cancer (PCa) and their functional implications. Our findings reveal that both miRNAs are significantly down-regulated in PCa tissues compared to non-cancerous tissues. Functional assays demonstrated that miR-1 and miR-133a inhibit cell proliferation, migration, and invasion in PCa cell lines by regulating purine nucleoside phosphorylase (PNP). This suggests that miR-1 and miR-133a may serve as potential therapeutic targets to suppress PCa progression.

Role of microRNA-1 and microRNA-133a in Inhibiting Prostate Cancer Progression via PNP Regulation
E N D
Presentation Transcript
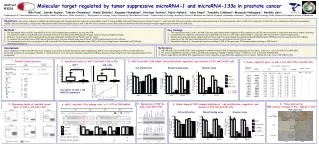
PCa (GS3+4 pT3N0) Non-PCa (n=22) PCa (n=28) Characteristic control mock mock si-control control 66 (53-72) 6.7 (4.3-19.5) 72 (63-88) 228 (7.23-2640) 8 (29%) 12 (42%) 8 (29%) 9 (32%) 19 (68%) 10 (36%) 18 (64%) 2 (7%) 14 (50%) 11 (39%) 1 (4%) Age (years) Median (range) PSA (ng/ml) Median (range) T stage T3a T3b T4 N stage N0 N1 M stage M0 M1 Gleason score 4+3 4+4 4+5 5+5 miR-1 miR-133a miR-1 si-PNP-1 PIN si-PNP-2 miR-133a Non-PCa X100 X400 Molecular target regulated by tumor suppressive microRNA-1 and microRNA-133a in prostate cancer Abstract #3226 Miki Fuse1, SatokoKojima2, Takeshi Chiyomaru3, Hideki Enokida3, Kazumori Kawakami3, Hirofumi Yoshino3, Nijiro Nohata1, Yukio Naya2, TomohikoIchikawa4, Masayuki Nakagawa3, NaohikoSeki1 1Department of Functional Genomics, Graduate School of Medicine, Chiba University, , 2Depatrment of Urology, Teikyo University Chiba Medical Center, 3Department of Urology, Graduate School of Medicine and Dental Sciences, Kagoshima University, 4Department of Urology, Chiba University Graduate School of Medicine Objectives: Our recent analyses of miRNA expression signatures showed significant reduction of microRNA-1 (miR-1) and microRNa-133a (miR-133a) in several types of cancer1,2,3. miR-1 and miR-133a are located on the same chromosomal locus in the human genome. miR-1-1/miR-133a-2 and miR-1-2/miR-133a-1 are clustered on different chromosomal regions, 20q13.33 and 18q11.2, respectively.We examined the functional significance of miR-1 and miR-133a in prostate cancer (PCa) cells and identified the novel molecular targets regulated by both miR-1 and miR-133a. • Methods: • The expression levels of miR-1 and miR-133a in PCa clinical samples were examined by real-time PCR. • The function of miR-1 and miR-133a were examined in PCa cell line (PC3 and DU145) using XTT assay, invasion assay and migration assay. • Molecular targets were identified by genome-wide gene expression analysis and luciferase reporter assay. • To examine the functional role of PNP, we performed loss-of-function analysis using two different si-PNP transfections into PCa cell lines. • The expression levels of the target gene of miR-1 and miR-133a, Purine nucleoside phosphorylase (PNP) in PCa clinical samples were examined by RT-PCR and Immunohistochemistry. • Key findings: • The expression levels of miR-1 and miR-133a were significantly down-regulated in PCa compared to non-PCa tissue and each of expression levels were highly correlated. • Cell proliferation, migration and invasion were inhibited in of miR-1 or miR-133atransfectants in comparison with mock and the control transfectants. • Genome-wide gene expression analysis and luciferase reporter assay showed that purine nucleoside phosphorylase (PNP) was directly regulated by both miRNAs. • Silencing of the PNP gene inhibited proliferation, migration, and invasion in both PCa cell lines. • Immunohistochemistry demonstrated positive staining of PNP in PCa specimens. PIN showed weaker staining of PNP as well. 18 16 14 12 Correlation of miR-1 and miR133aexpression 10 8 miR-1 expression 6 4 2 0 miR-133a expression 1. Patients characteristics 2. Expression levels of miR-1 and miR-133a in PCa 3.miR-1 and miR-133a inhibit cell proliferation, migration, and invasion in PC3 and DU145 cells 4. Down-regulated genes in miR-1 and miR-133a transfectants Fold Change (log2 ratio) Entrez Gene ID Invasion assay Cell proliferation Wound healing assay Target sites Symbol PC3 Average DU145 miR-1 miR-133a 11. . 30 120 120 120 miR-1 miR-133a miR-1 P<0.0001 miR-133a miR-133a miR-1 P<0.0001 25 5. Expression levels of possible target gens of miR-1 and miR-133a 8407 51776 79819 83990 5819 201895 4860 29956 79026 4323 53340 252983 56267 146779 -3.40 -1.77 -1.63 -2.95 -2.80 -2.33 -2.14 -1.15 -1.33 -1.21 -1.43 -1.03 -1.14 -1.10 TAGLN2 ZAK WDR78 BRIP1 PVRL2 C4orf34 PNP LASS2 AHNAK MMP14 SPA17 STXBP4 CCBL2 EFCAB3 -2.60 -2.97 -2.91 -1.86 -1.57 -2.28 -1.31 -2.45 -2.15 -1.01 -1.00 -1.40 -1.22 -1.08 -1.56 -1.38 -1.22 -1.04 -1.78 -1.17 -2.08 -1.12 -1.23 -1.52 -1.42 -1.09 -1.14 -1.16 -1.71 -2.33 -1.81 -1.68 -1.06 -1.38 -1.54 -1.48 -1.23 -1.54 -1.11 -1.35 -1.02 -1.17 + - + - + + + + - - - + - - + - + - - + + + - + - + + - -2.32 -2.11 -1.89 -1.88 -1.80 -1.79 -1.77 -1.55 -1.48 -1.32 -1.24 -1.22 -1.13 -1.13 * 20 100 100 100 expression levels of miRNA * 15 ** 80 ** 10 80 80 Cell proliferation (% of mock) Invasion cell number (% of mock) 5 Wound closure (% of mock) 60 60 60 0 PCa Non-PCa PCa Non-PCa ** ** 40 ** 40 40 ** ** ** 20 20 20 ** **: P < 0.0001 *: p < 0.0005 0 0 0 PC3 DU145 PC3 DU145 PC3 DU145 9. Tissue microarray PNP express strongly in PCa, slightly in PIN 7. Repression of PNP by miR-1and miR-133a 8. Knock-down of PNP induced inhibition of cell proliferation, migration, and invasion in PC3 and DU145 cells 6. miR-1 and miR-133a binding sites in 3’-UTR of PNP mRNA 120 100 ** ** PNP expression 80 Cell proliferation (% of mock) Cell proliferation Wound healing assay Invasion assay 60 40 120 120 20 100 100 0 80 80 ** ** PC3 DU145 Invasion cell number (% of mock) Wound closure (% of mock) 1.2 60 60 ** 1.0 ** 0.8 ** ** 40 0.6 40 ** ** Conclusions: Down-regulation ofmiR-1 and miR-133a was a frequent event in PCa and both function as tumor suppressors. PNP is a novel target gene of miR-1 and miR-133a and potentially functions as an oncogene. Therefore, identification of novel molecular networks regulated by miRNAs may provide new insights into the underlying causes of PCaoncogenesis. References: 1, miR-145, miR-133a and miR-133b: Tumor-suppressive miRNAs target FSCN1 in esophageal squamous cell carcinoma.Kano et al , Int.J Can 2010 127:2804-2814 2, The tumour-suppressive function of miR-1 and miR-133a targeting TAGLN2 in bladder cancer. Yoshino et al, Br J Can 2011 104:808-818 3, Tumour suppressive microRNA-874 regulates novel cancer networks in maxillary sinus squamous cell carcinoma.Nohata et al, Br J Can 2011 105:833-841 0.4 0.2 20 20 0 **: P < 0.0001 - - + + Position 365-371 deletion 0 0 PC3 DU145 DU145 PC3 DU145 PC3 - + + - Position 407-413 deletion DU145 PC3