Download
1 / 34
340 likes | 488 Vues
Yan Y. Kagan Dept. Earth and Space Sciences, UCLA, Los Angeles, CA 90095-1567, ykagan@ucla.edu , http://eq.ess.ucla.edu/~kagan.html. STATISTICAL DISTRIBUTIONS OF EARTHQUAKE NUMBERS: CONSEQUENCE OF BRANCHING PROCESS. http://minotaur.ess.ucla.edu/~ykagan/sden.ppt. Abstract.

E N D
Yan Y. Kagan Dept. Earth and Space Sciences, UCLA, Los Angeles, CA 90095-1567, ykagan@ucla.edu, http://eq.ess.ucla.edu/~kagan.html STATISTICAL DISTRIBUTIONS OF EARTHQUAKE NUMBERS:CONSEQUENCE OF BRANCHING PROCESS http://minotaur.ess.ucla.edu/~ykagan/sden.ppt
Abstract. We discuss various statistical distributions of earthquake numbers. Previously we derived several discrete distributions to describe earthquake numbers for the branching model of earthquake occurrence: these distributions are the Poisson, geometric, logarithmic, and the negative binomial (NBD). The theoretical model is the `birth and immigration' population process. The first three distributions above can be considered special cases of the NBD. In particular, a point branching process along the magnitude (or log seismic moment) axis with independent events (immigrants) explains the magnitude/moment-frequency relation and the NBD of earthquake counts in large time/space windows, as well as the dependence of the NBD parameters on the magnitude threshold. We discuss applying these distributions, especially the NBD, to approximate event numbers in earthquake catalogs. There are many different representations of the NBD. Most can be traced either to the Pascal distribution or to the mixture of the Poisson distribution with the gamma law. We discuss advantages and drawbacks of both representations for statistical analysis of earthquake catalogs. We also consider applying the NBD to earthquake forecasts and describe the limits of the application for the given equations. In contrast to the one-parameter Poisson distribution so widely used to describe earthquake occurrence, the NBD has two parameters. The second parameter can be used to characterize clustering or over-dispersion of a process. We determine the parameter values and their uncertainties for several local and global catalogs, and their subdivisions in various time intervals, magnitude thresholds, spatial windows, and tectonic categories. The theoretical model of how the clustering parameter depends on the corner (maximum) magnitude can be used to predict future earthquake number distribution in regions where very large earthquakes have not yet occurred.
References: Bartlett, M. S., 1978. An Introduction to Stochastic Processes with Special Reference to Methods and Applications, Cambridge, Cambridge University Press, 3rd ed., 388 pp. Bird, P., and Y. Y. Kagan, 2004. Plate-tectonic analysis of shallow seismicity: apparent boundary width, beta, corner magnitude, coupled lithosphere thickness, and coupling in seven tectonic settings, Bull. Seismol. Soc. Amer., 94(6), 2380-2399 (plus electronic supplement). Evans, D. A., 1953. Experimental evidence concerning contagious distributions in ecology, Biometrika, 40(1-2), 186-211, Hilbe, J. M., 2007. Negative Binomial Regression, New York, Cambridge University Press, 251 pp. Jackson, D. D., and Y. Y. Kagan, 1999. Testable earthquake forecasts for 1999, Seism. Res. Lett., 70(4), 393-403. Kagan, Y. Y., 1973. Statistical methods in the study of the seismic process (with discussion: Comments by M. S. Bartlett, A. G. Hawkes, and J. W. Tukey), Bull. Int. Statist. Inst., 45(3), 437-453. Scanned version of text is available at http://moho.ess.ucla.edu/~kagan/Kagan_1973b.pdf Kagan, Y. Y., 1991. Likelihood analysis of earthquake catalogues, Geophys. J. Int., 106(1), 135-148. Kagan, Y. Y., P. Bird, and D. D. Jackson, 2009. Earthquake Patterns in Diverse Tectonic Zones of the Globe, accepted by Pure Appl. Geoph. (Seismogenesis and Earthquake Forecasting: The Frank Evison Volume), hfilbreak http://scec.ess.ucla.edu/~ykagan/globe_index.html . Kagan, Y. Y., and D. D. Jackson, 1991. Long-term earthquake clustering, Geophys. J. Int., 104(1), 117-133. Ogata, Y., 1998. Space-time point-process models for earthquake occurrences, Ann. Inst. Statist. Math., 50(2), 379-402. Schorlemmer, D., J. D. Zechar, M. Werner, D. D. Jackson, E. H. Field, T. H. Jordan, and the RELM Working Group, 2009. First results of the Regional Earthquake Likelihood Models Experiment, Pure and Applied Geophysics, accepted. Sornette, D., and M.J. Werner, 2005. Apparent clustering and apparent background earthquakes biased by undetected seismicity, J. Geophys. Res., 110(9), B09303, doi:10.1029/2005JB003621 . Zhuang, J. C., Y. Ogata, and D. Vere-Jones, 2004. Analyzing earthquake clustering features by using stochastic reconstruction, J. Geophys. Res., 109(B5), Art. No. B05301.
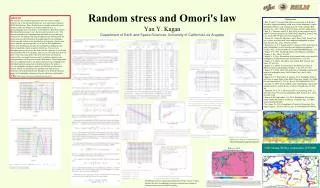
(a) Branching in moment or magnitude Kagan (1973a,b) (b) Branching in time (Kagan, 1991 or ETAS)
Probability generating function Geometric distribution
Negative binomial distribution: Logarithmic distribution:
NBD standard representation (Matlab) NBD alternative representation NBD Evans’s representation
CATALOGS: • CIT (CalTech) catalog (Southern California) Hileman, J. A., C. R. Allen, and J. M. Nordquist, 1973. Seismicity of the Southern California Region, 1 January 1932 to 31 December 1972, Cal. Inst. Technology, Pasadena. • CMT Global catalog Ekstrom, G., A. M. Dziewonski, N. N. Maternovskaya and M. Nettles, 2005. Global seismicity of 2003: Centroid-moment-tensor solutions for 1087 earthquakes, Phys. Earth planet. Inter., 148(2-4), 327-351. • PDE Global catalog Preliminary determinations of epicenters (PDE), 2008. U.S. Geological Survey, U.S. Dep. of Inter., Natl. Earthquake Inf. Cent., http://neic.usgs.gov/neis/epic/epic.html
In column 1: G means that the global catalog is used, 0 -- plate interior, 1 -- Active continent, 2 -- Slow ridge, 3 -- Fast ridge, 4 -- Trench (subduction zones), see Kagan et al., 2009; n is the number of earthquakes, N is the number of time intervals, Delta T – interval duration in days.
In column 1: G means that the global catalog is used, 0 -- plate interior, 1 -- Active continent, 2 -- Slow ridge, 3 -- Fast ridge, 4 -- Trench (subduction zones), see Kagan et al., 2009; n is the number of earthquakes, N is the number of time intervals, Delta T – interval duration in days.
In column 1: G means that the whole CIT catalog is used, SE -- south-east part of southern California, NE -- north-east, SW -- south-west, NW -- north-west; n is the number of earthquakes, N is the number of time intervals, Delta T – interval duration in days.
Dependence of the log-likelihood difference for the NBD and Poisson models of earthquake occurrence on the threshold magnitude. The CIT catalog 1932-2001 is used, annual event numbers are analyzed. The magenta line corresponds to l - l_0= 1.92; for a higher log-likelihood difference level the Poisson hypothesis should be rejected at the 95% confidence limit.
END Thank you