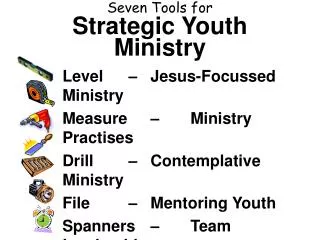
Seven Tools for TQM
Seven Tools for TQM. Tools for TQM. Quality Function Deployment House of Quality Taguchi technique Quality loss function Pareto charts Process charts Cause-and-effect diagrams Statistical process control. Tools of TQM. Tools for generating ideas Check sheet Scatter diagram

Seven Tools for TQM
E N D
Presentation Transcript
Tools for TQM • Quality Function Deployment • House of Quality • Taguchi technique • Quality loss function • Pareto charts • Process charts • Cause-and-effect diagrams • Statistical process control
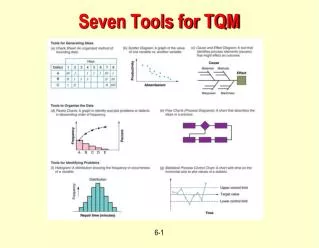
Tools of TQM • Tools for generating ideas • Check sheet • Scatter diagram • Cause and effect diagram • Tools to organize data • Pareto charts • Process charts (Flow diagrams) • Tools for identifying problems • Histograms • Statistical process control chart
Pareto Analysis of Wine Glass Defects (Total Defects = 75) 72% 16% 5% 4% 3%
Process Chart • Shows sequence of events in process • Depicts activity relationships • Has many uses • Identify data collection points • Find problem sources • Identify places for improvement • Identify where travel distances can be reduced
Cause and Effect Diagram • Used to find problem sources/solutions • Other names • Fish-bone diagram, Ishikawa diagram • Steps • Identify problem to correct • Draw main causes for problem as ‘bones’ • Ask ‘What could have caused problems in these areas?’ Repeat for each sub-area.
Problem Too many defects Cause and Effect Diagram Example
Cause and Effect Diagram Example Method Manpower Main Cause Too many defects Material Machinery Main Cause
Cause and Effect Diagram Example Method Manpower Drill Overtime Too many defects Wood Steel Lathe Material Machinery Sub-Cause
Tired Drill Overtime Slow Too many defects Old Wood Steel Lathe Cause and Effect Diagram Example Method Manpower Material Machinery
Statistical Process Control (SPC) • Uses statistics & control charts to tell when to adjust process • Developed by Shewhart in 1920’s • Involves • Creating standards (upper & lower limits) • Measuring sample output (e.g. mean wgt.) • Taking corrective action (if necessary) • Done while product is being produced
Statistical Process Control Steps Produce Good Start Provide Service No Assign. Take Sample Causes? Yes Inspect Sample Stop Process Create Find Out Why Control Chart
Basic Steps in Problem Solving • Define the problem and establish an improvement goal • Collect data • Analyze the problem • Generate potential solutions • Choose a solution • Implement the solution • Monitor the solution to see if it accomplishes the goal
Plan Act Do Study The PDSA Cycle
Process Improvement • Process Improvement: A systematic approach to improving a process • Process mapping • Analyze the process • Redesign the process
Select a process Document Study/document Evaluate Seek ways to Improve it Implement the Improved process Design an Improved process The Process Improvement Cycle
Process Improvement and Tools • Process improvement - a systematic approach to improving a process • Process mapping • Analyze the process • Redesign the process • Tools • There are a number of tools that can be used for problem solving and process improvement • Tools aid in data collection and interpretation, and provide the basis for decision making
Methods for Generating Ideas • Brainstorming • Quality circles • Interviewing • Benchmarking • 5W2H
Quality Circles • Team approach • List reduction • Balance sheet • Paired comparisons