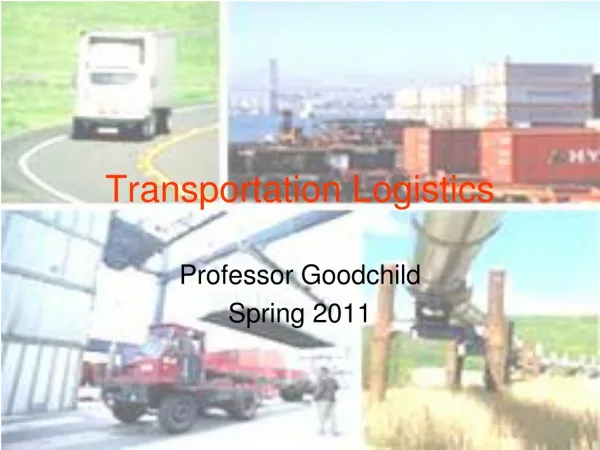
Transportation Logistics
Transportation Logistics. Professor Goodchild Spring 2011. Link Costs. TSP and VRP assume cost of travel between 2 points problem input There are formulations where these costs can vary over time, or by vehicle type Cost = a*time + b*distance What else matters?. Link Travel Times.

Transportation Logistics
E N D
Presentation Transcript
Transportation Logistics Professor Goodchild Spring 2011
Link Costs • TSP and VRP assume cost of travel between 2 points problem input • There are formulations where these costs can vary over time, or by vehicle type • Cost = a*time + b*distance • What else matters?
Link Travel Times • Depend on volume of traffic • Link performance functions • Link cost functions • T=f(flow on link)
Wardrop’s First Principal • The journey times in all routes actually used are equal and less than those which would be experienced by a single vehicle on any unused route. • Each user non-cooperatively seeks to minimize his cost of transportation. • Referred to as "user equilibrium" (UE) flows. • User-optimized equilibrium is reached when no user may lower his transportation cost through unilateral action.
Wardrop’s Second Principal • At equilibrium the average journey time is minimum. • This implies that each user behaves cooperatively in choosing his own route to ensure the most efficient use of the whole system. • Referred to as "system optimal" (SO). • Economists argue this can be achieved with marginal costroad pricing.
D1 Link 1 Flow = X1 Cost = Z1 Link 3 Flow = X3 Cost = X3 O Link 2 Flow = X2 Cost = Z2 D2 • Given OD flow from O to D2 is 4 • Choose fraction of flow to travel link 1 and 3 or link 2 • Identify UE solution, SO solution
D1 Link 1 Flow = X1 Cost = Z1 Link 3 Flow = X3 Cost = X3 O Link 2 Flow = X2 Cost = Z2 D2 X1=4(1+x), X2=4(1-x), X3=4x x is fraction of items for D2 sent through D1 Z1=1/X1, Z2=X2, Z3=1 Total Cost = X1Z1+X2Z2+X3Z3 UE: travel cost on both links equivalent SO: minimize total travel cost
D1 Link 1 Flow = X1 Cost = Z1 Link 3 Flow = X3 Cost = X3 O Link 2 Flow = X2 Cost = Z2 D2 UE: x=.7 SO: x=.5
D1 Link 1 Flow = X1 Cost = Z1 Link 3 Flow = X3 Cost = X3 O Link 2 Flow = X2 Cost = Z2 D2 X1=4(1+x), X3=4x, X2=4(1-x) Z1=X1-1/2, Z2=3X2-1/2, Z3=1 Total Cost = X1Z1+X2Z2+X3Z3 Total Cost = 2(1+x)1/2+6(1-x)1/2+4x
X1=4(1+x), X3=4x, X2=4(1-x) Total Cost = X1Z1+X2Z2+X3Z3 Z1=X1-1/2, Z2=3X2-1/2, Z3=1 Total Cost = 2(1+x)1/2+6(1-x)1/2+4x Higher the flow, lower the per unit cost – economy of scale Which links have economies of scale?
Total cost minimized at x=1 Total cost = 6.8 Total cost x Want to send everything on the same route
Questions • How does the length of a tour change with demand density? • How does the number of drivers change with the length of a tour? • How would you calculate the demand density with 30 minute time windows versus 2 hour time windows?
Tailored Strategies • Tighter time windows for customers that are willing to pay more. • Deliveries outside of peak travel periods. • Allow transportation companies to expand their markets. • Increase logistical complexity.