2002 Freight Analysis Framework 2
2002 Freight Analysis Framework 2. T. Randall (Randy) Curlee, Ph.D. Center for Transportation Analysis Talking Freight Seminar February 15, 2006. T. Randall Curlee, Ph.D, Economics Frank Southworth, Ph.D., Geography Bruce Peterson, M.S., Geography Richard Schmoyer, Ph.D., Statistics

2002 Freight Analysis Framework 2
E N D
Presentation Transcript
2002Freight Analysis Framework2 T. Randall (Randy) Curlee, Ph.D. Center for Transportation Analysis Talking Freight Seminar February 15, 2006
T. Randall Curlee, Ph.D, Economics Frank Southworth, Ph.D., Geography Bruce Peterson, M.S., Geography Richard Schmoyer, Ph.D., Statistics David Vogt, Ph.D.,Economics Gbadebo Oladosu, Ph.D., Economics Ingrid Busch, Ph.D., Operations Research S. M. Chin, Ph.D., Civil Engineering Ho-Ling Hwang, Ph.D., Statistics Maxine Perry, M.S., Geography The ORNL FAF Team
FAF2 OD Methodology Iterative Proportional Fitting Enhanced CFS Flows Matrix CFS Table 17 Log Linear Model CFS Out-of-Scope Sectors “True Zero” Cells from Census CFS Alternatives: Railcar Waybills Waterborne Commerce Final FAF2 Flows Table
FAF2 OD Methodology FAF2 Dimensions * 114 origins and destinations as defined and used in the 2002 Commodity Flow Survey (CFS) plus 17 additional international gateways and 7 international regions * Commodities defined at the 2-digit SCTG (Standard Classification of Transported Goods) level * Modes defined as in the 2002 CFS – i.e. 11 separate modes, multimodal combinations, and unknown modes— but reported for only 7 aggregated modes in FAF * Two four-dimensional matrices with approximately 12 million cells Final FAF2 Flows Table
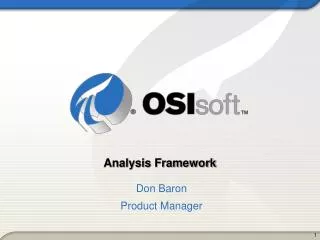
138 FAF Regions Notes: Metropolitan areas shown in green, gateways shown in purple. Not shown: Alaska (3), Honolulu (26), Hawaii (27), and the Anchorage Gateway (115)
SCTG - Commodity Code Code Commodity Class 01 Live animals and live fish 02 Cereal grains 03 Other agricultural products 04 Animal feed and products of animal origin, n.e.c. 05 Meat, fish, seafood, and their preparations 06 Milled grain products and preparations, and bakery products 07 Other prepared foodstuffs and fats and oils 08 Alcoholic beverages 09 Tobacco products 10 Monumental or building stone 11 Natural sands 12 Gravel and crushed stone 13 Nonmetallic minerals n.e.c. 14 Metallic ores and concentrates 15 Coal 16 Crude Petroleum 17 Gasoline and aviation turbine fuel 18 Fuel oils 19 Coal and petroleum products, n.e.c. 20 Basic chemicals 21 Pharmaceutical products 22 Fertilizers 23 Chemical products and preparations, n.e.c. 24 Plastics and rubber 25 Logs and other wood in the rough 26 Wood products 27 Pulp, newsprint, paper, and paperboard 28 Paper or paperboard articles 29 Printed products 30 Textiles, leather, and articles of textiles or leather 31 Nonmetallic mineral products 32 Base metal in primary or semi-finished forms and in finished basic shapes 33 Articles of base metal 34 Machinery 35 Electronic and other electrical equipment and components and office equipment 36 Motorized and other vehicles (including parts) 37 Transportation equipment, n.e.c. 38 Precision instruments and apparatus 39 Furniture, mattresses and mattress supports, lamps, lighting fittings, and... 40 Miscellaneous manufactured products 41 Waste and scrap 43 Mixed freight — Commodity unknown FAF2 Commodities
FAF2 Modes • Truck • Rail • Water • Air, Air & Truck • Truck and Rail • Other Intermodal • Pipeline & Unknown
FAF2 OD Methodology Iterative Proportional Fitting Enhanced CFS Flows Matrix CFS Table 17 Log Linear Model CFS Out-of-Scope Sectors “True Zero” Cells from Census CFS Alternatives: Railcar Waybills Waterborne Commerce Final FAF2 Flows Table
FAF2 OD Methodology CFS Table 17 • 4 dimensional matrix at state level with required mode and commodity detail • A very large and very sparse multi-dimensional table • Sparsely filled – only about 5% of cells filled • * Coefficient of variation of greater than 50% • * Disclosure rules • * No observations
FAF2 OD Methodology Iterative Proportional Fitting Enhanced CFS Flows Matrix CFS Table 17 Log Linear Model CFS Out-of-Scope Sectors “True Zero” Cells from Census CFS Alternatives: Railcar Waybills Waterborne Commerce Final FAF2 Flows Table
FAF2 OD Methodology CFS Table 17 Census identified all missing cells for which there were no observations Those cells assumed to be “true zeros” and constrained to be so Remaining missing cells are suppressed and must be estimated “True Zero” Cells from Census
FAF2 OD Methodology Iterative Proportional Fitting Enhanced CFS Flows Matrix CFS Table 17 Log Linear Model CFS Out-of-Scope Sectors “True Zero” Cells from Census CFS Alternatives: Railcar Waybills Waterborne Commerce Final FAF2 Flows Table
FAF2 OD Methodology • Identifies relationships at 7 dimensional level • * Modes • * Commodities • * Origins • * Destinations • * Tons, Dollars • * Distance Bucket • * CFS, Alternative data source • 127 terms in fully saturated model CFS Table 17 Log Linear Model CFS Alternatives: Railcar Waybills Waterborne Commerce Alternative data converted to SCTG
FAF2 OD Methodology Iterative Proportional Fitting Enhanced CFS Flows Matrix CFS Table 17 Log Linear Model CFS Out-of-Scope Sectors “True Zero” Cells from Census CFS Alternatives: Railcar Waybills Waterborne Commerce Final FAF2 Flows Table
FAF2 OD Methodology Iterative Proportional Fitting CFS Table 17 IPF constrains margins to be consistent with CFS totals Cells with values in Table 17 constrained to remain unchanged
FAF2 OD Methodology Iterative Proportional Fitting Enhanced CFS Flows Matrix CFS Table 17 Log Linear Model CFS Out-of-Scope Sectors “True Zero” Cells from Census CFS Alternatives: Railcar Waybills Waterborne Commerce Final FAF2 Flows Table
FAF2 OD Methodology Enhanced CFS Flows Matrix CFS Table 17 Enhanced CFS Flows Matrix is fully populated at required 4 dimensional level Does not include flows that are out-of-scope to the CFS or flows that are generally acknowledged to be undercounted in the CFS
FAF2 OD Methodology Iterative Proportional Fitting Enhanced CFS Flows Matrix CFS Table 17 Log Linear Model CFS Out-of-Scope Sectors “True Zero” Cells from Census CFS Alternatives: Railcar Waybills Waterborne Commerce Final FAF2 Flows Table
FAF2 OD Methodology Enhanced CFS Flows Matrix • 15 special studies to estimate Out-of-Scopes and Undercounts (with MacroSys) • Farm Based Movements • Fisheries • Crude Petroleum • Natural Gas • Municipal Solid Waste CFS Out-of-Scope Sectors
FAF2 OD Methodology Enhanced CFS Flows Matrix ORNL disaggregated all Out-of-Scopes and Undercounts to the required FAF regional level Methodologies specialized to specific flows CFS Out-of-Scope Sectors
FAF2 OD Methodology Iterative Proportional Fitting Enhanced CFS Flows Matrix CFS Table 17 Log Linear Model CFS Out-of-Scope Sectors “True Zero” Cells from Census CFS Alternatives: Railcar Waybills Waterborne Commerce Final FAF2 Flows Table
FAF2 OD Methodology Enhanced CFS Flows Matrix Out-of-Scope Matrix added to Enhanced CFS Flows Matrix Straightforward both conceptually and mechanically CFS Out-of-Scope Sectors Final FAF2 Flows Table
FAF2 OD Methodology Iterative Proportional Fitting Enhanced CFS Flows Matrix CFS Table 17 Log Linear Model CFS Out-of-Scope Sectors “True Zero” Cells from Census CFS Alternatives: Railcar Waybills Waterborne Commerce Final FAF2 Flows Table We thus arrive at the Final FAF2 Flows Table
FAF2 OD Methodology Iterative Proportional Fitting Enhanced CFS Flows Matrix CFS Table 17 Log Linear Model CFS Out-of-Scope Sectors “True Zero” Cells from Census CFS Alternatives: Railcar Waybills Waterborne Commerce Final FAF2 Flows Table Questions??