Download
1 / 1
10 likes | 164 Vues
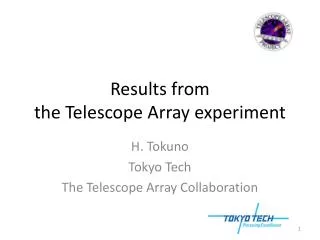
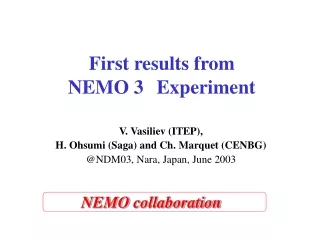
First r esults from the NEMO Test Site. hydrophones. electronics housing. The NEMO Test Site in Catania. O DE: Ocean noise Detection Experiment.

E N D
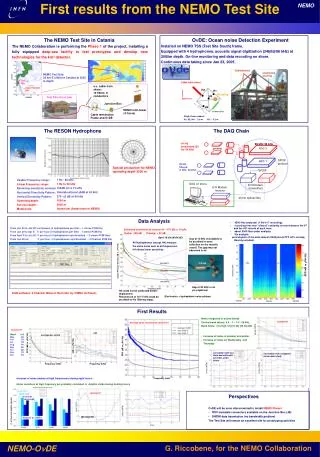
First results from the NEMO Test Site hydrophones electronics housing The NEMO Test Site in Catania ODE: Ocean noise Detection Experiment The NEMO Collaboration is performing the Phase 1 of the project, installing a fully equipped deep-sea facility to test prototypes and develop new technologies for the km3 detector. Installed on NEMO TSS (Test Site South) frame. Equipped with 4 hydrophones, acoustic signal digitization (24bit@96 kHz) at 2000m depth. On-line monitoring and data recording on shore. Continuous data taking since Jan 23, 2005. NEMO Test Site: 25 km E offshore Catania at 2000 m depth Cable from shore e.o. cable from shore: 10 fibers, 6 conductors H2 H1 Housing H3 Test Site shore Lab North 110° Junction Box H4 2.5 m NEMO mini-tower (4 floors) connectors Cable termination Frame and ODE Height from seabed : H1, H2, H4: ~ 2.6 m H3: ~ 3.2 m The RESON Hydrophone The DAQ Chain H1-H3 broad band (30 Hz- 50 kHz) 96 kHz 24 bits ADC 2 preamp SPDIF protocol ADC 1 H2-H4 filtered (1 kHz- 50 kHz) Special production for NEMO operating depth 2500 m SPDIF 1 Hz - 80 kHz 1 Hz to 50 kHz 194dB ±3 re 1V/uPa Omnidirectional ±2dB at 40 kHz 270° ±3 dB at 40 kHz 1500 m 2000 m Aluminum (Seabronze for NEMO) Usable Frequency range: Linear Frequency range: Receiving sensitivity nominal: Horizontal Directivity Pattern: Vertical Directivity Pattern: Operating depth: Survival depth: Metal body: DAQ on shore E/O Modem transmitters E/OModem receiver 25 km optical fibre Data Analysis • 4200 files analysed (1 file 5’ recording); • recording time was “almost” randomly chosen between the 0th and the 45th minute of each hour; • about 3000 files under analysis; • file analysis: • periodogram of the data sample (2048 points FFT, 50% overlap, Hanning window). From Jan 23 to Jan 28: continuous (2 hydrophones per time – 1 stereo PCM file) From Jan 29 to Apr 8: 5’ per hour (2 hydrophones per time – 1 stereo PCM file) From April 9 to Jun 28: 5’ per hour (4 hydrophones synchronized – 2 stereo PCM files) From Jun 29 on: 5’ per hour (4 hydrophones synchronized – 4 Channel PCM file) Estimated sensitivity of channel H1 :-175 dB re 1V/Pa Hydro: -195 dB Preamp: + 20 dB April 16 (04:00-04:05) Gap at 10 kHz is probably to be ascribed to wave reflection on the metallic vessel. The gap was not observed in air. All Hydrophones (except H4) measure the same noise level at all frequencies. H4 shows lower sensitivity channel H1 Sound Pressure Density (dB re Pa2/Hz) 1.5 cm SPD (dB re Pa2/Hz) Gap at 28 kHz is not yet explained H4 could not be calibrated before deployment. Resonances at 15-17 kHz could be ascribed to the filtering stage. DAQ software: 4 Channel Wave-in Recorder by CIBRA (G.Pavan) Electronics + hydrophone noise plateau First Results Noise integrated in octave bands Central band values: 3.5 – 7 – 14 – 28 kHz Band limits: [2.5 5] [5 10] [10 20] [20 40] kHz channel H1 Average noise recorded by channel H1 noise (mPa) channel H1 std Month # files May 350 Jun 120 Jul 738 Aug 744 Sep 563 Oct 602 Nov 720 Dec 336 average per month • Increase of noise in summer and winter • Increase of noise on Wednesday and Thursday SPD (dB re Pa2/Hz) (dB re Pa2/Hz) SPD (dB re Pa2/Hz) Correlation with sea state and anthropic activities under study Correlation with navigation noise under study Frequency (kHz) Frequency (kHz) noise (mPa) noise (mPa) Frequency (kHz) Increase of noise (mainly at high frequencies) during night hours: Noise variations at high frequency are probably correlated to dolphin clicks during hunting hours 00:00-06:00 channel H1 06:00-12:00 Perspectives 12:00-18:00 18:00-24:00 noise (mPa) • ODE will be soon disconnected to install NEMO Phase1 • ROV mateable connectors available on the Junction Box (JB) • DWDM data trasmission (no bandwidth problem) • The Test Site will remain an excellent site for prototyping activities noise (mPa) (% of files with dolphin signals) [20 40] kHz Analysis by CIBRA hour G. Riccobene, for the NEMO Collaboration