Download
1 / 8
80 likes | 145 Vues
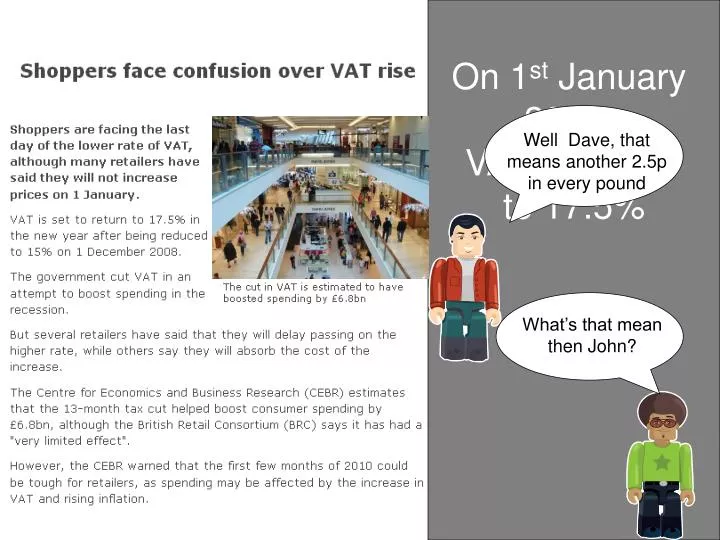
On 1 st January 2010, VAT returned to 17.5%. What’s that mean then John?. Well Dave, that means another 2.5p in every pound. Do you agree with John? How would you explain the VAT increase?. Who are the winners and losers in the VAT increase? Does the Government

E N D
On 1st January 2010, VAT returned to 17.5% What’s that mean then John? Well Dave, that means another 2.5p in every pound
Do you agree with John? How would you explain the VAT increase?
Who are the winners and losers in the VAT increase? Does the Government gain a lot of revenue? Is it worth it?
Who are the winners and losers in the VAT increase? How much extra does the consumer pay? Would it stop you buying a Wii?
Up2d8 mathsVAT rise Teacher Notes
VAT rise Introduction: On 1 January 2010, VAT returned to 17.5% after being reduced to 15% on 1 December 2008. The Government cut the VAT rate to try to boost shopping in the recession. Now some retailers say that they will absorb the VAT increase rather than passing it on to consumers. This resource invites pupils to tackle the widely held misconception that an increase from 15% to 17.5% is the same as an extra 2.5p in the pound Content objectives: • use fractions or percentages to solve problems involving repeated proportional changes or the calculation of the original quantity given the result of a proportional change • understand and use proportional changes, calculating the result of any proportional change using only multiplicative methods • pupils develop and follow alternative approaches. They compare and evaluate representations of a situation, introducing and using a range of mathematical techniques. Process objectives: These will depend on the amount of freedom you allow your class with the activity. It might be worth considering how you’re going to deliver the activity and highlighting the processes that this will allow on the diagram below:
Activity:Having been introduced to the situation of a return of VAT to 17.5% in January 2010, students are asked to comment on John’s explanation that this is 2.5p in the pound. They are then asked to consider who are the winners and losers in this situation. Does the Government generate a significant amount of income from this tax rise? Would this extra amount of tax deter consumers from buying a new Wii say? Differentiation:You may decide to change the level of challenge for your group. To make the task easier you could consider: • working out prices of goods after the VAT rise • designing and implementing a questionnaire to find out what people think about the VAT rise. To make the task more complex, you could consider: • calculating the actual percentage increase • generalising the findings. This resource is designed to be adapted to your requirements. Outcomes:You may want to consider what the outcome of the task will be and share this with students according to their ability. This could be: • an explanation to give to Dave and John • a poster explaining the price rises • a letter to the Government persuading them that it IS worth their while to increase VAT to 17.5% – or higher • a letter to the Government persuading them that it is better to keep VAT at 15%. Working in groups: This activity lends itself to paired and small group work and, by encouraging students to work collaboratively, it is likely that you will allow them access to more of the key processes than if they were to work individually. You will need to think about how your class will work on this task. Will they work in pairs, threes or larger groups? If pupils are not used to working in groups in mathematics, you may wish to spend some time talking about their rules and procedures to maximise the effectiveness and engagement of pupils in group work (you may wish to look at the SNS Pedagogy and practice pack Unit 10: Guidance for groupwork). You may wish to encourage the groups to delegate different areas of responsibility to specific group members – some of the group could look at the first task only, for example. Assessment:You may wish to consider how you will assess the task and how you will record your assessment. This could include developing the assessment criteria with your class. You might choose to focus on the content objectives or on the process objectives. You might decide that this activity lends itself to comment-only marking or to student self-assessment. If you decide that the outcome is to be a presentation or a poster, then you may find that this lends itself to peer assessment.
Probing questions: Initially students could brainstorm issues to consider. You may wish to introduce some points into the discussion, which might include: • why is there VAT on some goods? • which goods have VAT on them? • who sets the rate? • was it a good idea to reduce the VAT rate in December 2009? • why do people think that a rise from 15% to 17.5% is the same as 2.5p in the pound? You will need: The PowerPoint display. There are four slides: The first slide introduces students to the VAT rise and introduces the misconception. The second slide invites students to explain the misconception. The third and fourth slides invite students to consider wider issues – who are the winners and losers in this situation?