Homework Assignment
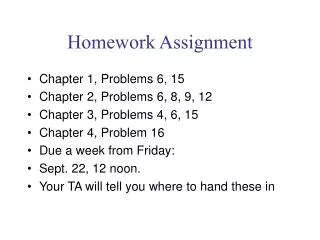
Homework Assignment. 10.17, 10.19, 10.23, 10.29, 10.32 Due in Class Dec 1. Last Time: Finished Contingency Tables Reviewed Basics on Linear Regression. Suppose I sample n many people:. How many observations do I expect to get in cell (i,j)?

Homework Assignment
E N D
Presentation Transcript
Homework Assignment 10.17, 10.19, 10.23, 10.29, 10.32 Due in Class Dec 1
Last Time:Finished Contingency TablesReviewed Basics on Linear Regression
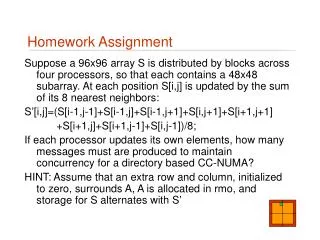
Suppose I sample n many people: • How many observations do I expect to get in cell (i,j)? • If the Null Hypothesis holds, i.e., if the columns and rows are independent, then I expect the number of observations in cell (i,j) to be How to compare?? Both are unknown!
Suppose I sample n many people: How to compare?? Both are unknown!
Finding a p-value for a Chi-Square Statistic (one-tailed) Table F (T-20)
Slight Change of Notation Homogeneity of parallel samples
Example 255 32 FIXED Equivalent Equations
More Generally: The rest is the same as in previous scenario, i.e., we get the same Chi-square again.
The Square of a Standard Normal Random Variableis a Chi-Square Random Variablewith 1 degree of freedom.
Today:From descriptive to inference statistics…Estimation and Hypothesis Testingfor Linear Regression
Statistical Inference (for a single variable) Estimation: (Confidence Intervals) Point estimate critical value Std. dev. of point estimate ± · For instance: Confidence Interval for the mean: ± ·
Statistical Inference (for a single variable) Hypothesis Testing:
Example 20 kindergarteners 1pt 2pts 3pts “Popularity Score” = Average Score
Example 20 kindergarteners “Social Competence Score”
Example 20 kindergarteners “Popularity Score” “Social Competence Score”
Statistical Inference (for two variables) Example: Children X: Popularity, Y: Social competence Goal: Explain (linear) relationship between X and Y
Y 1 X
Simple (linear) regression Explain the (linear) relationship (if it exists) between random variable X and random variable Y.
Four assumptions about the error term 4 For different values of X, the error terms are uncorrelated 1 3 2 The error term is a normally distributed random variable No matter what value X takes, the error has a mean of zero
Second assumption: Average error is zero for each value of X 1 X
3rd assumption: Error has same standard deviation for each value of X Y Error X
Y X
Y X
We will sample data to estimate the parameters. This leads to point estimates, confidence intervals and hypothesis testing for each parameter, in addition to a general test of the model as a whole.
Estimation of Intercept and Slope:(just a change of notation)
Parameter Estimates: Degrees of freedom loose 1 df for X loose 1 df for Y
Recall: Point Estimates (Sample Statistics) are Random Variables
Recall: Point Estimates (Sample Statistics) are Random Variables Sampling Distributions
Recall: Point Estimates (Sample Statistics) are Random Variables Don’t Know! Hypothesis Testing
Remember the general rule for Confidence Intervals: Point estimate critical value Std. dev. of point estimate ± ·
Confidence Intervals for Intercept and Slope Point estimate critical value Std. dev. of point estimate ± ·
Hypothesis Test on Slope If p-value of the standardized statistic < then reject H0 and conclude that there is indeed a linear relationship
Computer Output(Note: Different programs differ in style and content!) p-value < .001
Analysis of Variancefor Regression How much y differs from mean How much predicted y differs from mean residual / error Involves only data