Download
1 / 87
870 likes | 951 Vues
Discover the varied regions and economic shifts in Montana, from the mountains to the plains. Explore population trends, migration patterns, and economic changes in different counties. Learn about the notable growth in the West compared to the East and Central regions. Follow the shifts in net migration and population growth, shedding light on Montana's evolving landscapes.

E N D
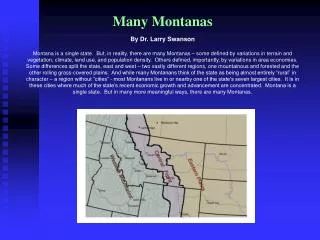
Many Montanas By Dr. Larry Swanson Montana is a single state. But, in reality, there are many Montanas – some defined by variations in terrain and vegetation, climate, land use, and population density. Others defined, importantly, by variations in area economies. Some differences split the state, east and west – two vastly different regions, one mountainous and forested and the other rolling grass-covered plains. And while many Montanans think of the state as being almost entirely “rural” in character – a region without “cities” - most Montanans live in or nearby one of the state’s seven largest cities. It is in these cities where much of the state’s recent economic growth and advancement are concentrated. Montana is a single state. But in many more meaningful ways, there are many Montanas.
Patterns of Net Migration in Montana During the decade of the 1980s, 53,000 more people moved from Montana than the number moving to Montana, changing their permanent residence in the process. However, this pattern of out migration dramatically reversed itself during the decade of the 1990s with nearly 51,000 more people moving to the state than away between 1990 and 1999. While this migration shift is a dramatic reversal, not all areas of Montana are sharing evenly in this net migration. The chart on the upper right shows how net migration statewide during the last two decades is allocated by the three general regions. During the ‘80s all three regions experienced net out-migration. However, most population loss resulting from this was in Montana’s Central Front, with net out-migration of 24,847. and Eastern Plains, with net out-migration of 23,072. Out-migration from the West was relatively small at just over 5,000. In the ‘90s when the direction of net migration reversed, the Western Mountains saw most of the gain with net in-migration of 57,493. The chart below shows net migration during the 1990s by county, with individual counties in the West at the left and counties in the East at the right. The three counties with the highest net in-migration are Flathead (10,920), Ravalli (10,377), and Gallatin (9,534), all in the West. Yellowstone County had the 4th highest net in-migration (7,850), followed by Missoula (6,208), Lewis and Clark (4,308), and Lake (4,158). The county with the single highest net out-migration is Cascade (-5,411). Virtually all of the counties in the Eastern Plains region continue to see net out-migration.
Population Change in Montana The recent “sea change” in U.S. population migration patterns played out very differently in Montana’s three regions. The 21 Western Mountain counties saw almost all of the increase with net migration shooting to nearly 58,000 in the ‘90s. The Central Front saw some of the increase. But the 21 Eastern Plains counties had even greater net out-migration than in the previous decade. Population counts through 2003 indicate these trends are continuing. Lop-sided Population Growth Montana’s population grew by almost 120,000 people between 1990 and 2003, after very little growth in the ‘80s. Over 85 percent of this population growth was the result of net migration. However, most of this growth is in the Western Mountain region (green bars), mainly in Gallatin, Flathead, Missoula, Ravalli, Lewis & Clark, and Lake Counties. Some of the growth is in the Central Front (purple bars), mainly in Yellowstone County. In the Eastern Plains (yellow bars), every county except one lost population.
Lop-sided Growth by Age Between 1980 and 2000, the population of the Western Mountain counties grew by over 110,000 people, but most of this growth was by persons at ages between their early 40s and early 60s (classic “baby boomers”). Population in the Central Front grew by over 21,000. But here numbers swelled among persons in the 40s and 50s, while shrinking among younger segments of the population. Population fell by nearly 19,000 in the Eastern Plains, with much of the decline focused across younger ages. The median age of the population statewide rose from 29 to 38 during this period.
Economic Change: West-to-East in Montana Economic conditions improved considerably in moving from the decade of the ‘80s to the decade of the ‘90s. In the Western Mountain region, total personal income adjusted for inflation grew by nearly $3.6 billion (up over 44%) in the ‘90s versus a gain of less than $1.2 billion in the ‘80s (+17%) – a more than three-fold increase in growth. The Central Front region also saw a more than three-fold increase in income growth. The Plains region went from negative growth to a small gain. Employment growth followed a similar pattern.
Net Migration Among Non-metro Forestland Counties in the West – 1980-1990 versus 1990-1999 Population growth in these forestland counties has been spurred by a “sea change” in migration patterns in the West, with more and more people moving to these types of areas. This growth coincides with significant declines in the wood products manufacturing industry in these areas, which is resulting in large-scale economic restructuring in the economies of these areas.
Areas Nearby National Parks In the West There are 80 western counties whose geographic center is within 40 miles of a major national park in the West. The majority of these (51) are non-metropolitan in character. The map shows major national parks in the 22 contiguous states west of the Mississippi River. Other federal lands adjacent to these parks are also shown.
Recent Employment Change in the Fast-growing Rockies and in Montana In the last decade when the economy of the Rocky Mountain West became one of the fastest-growing regional economies in the nation, employment growth in the broad services sector accounted for 37 percent of all new jobs in the region. The top chart shows employment change in the five-state region by major sector over the course of the last twenty years. There are 13 major sectors of the economy and two of these, services and retail trade, now account for nearly half of all employment. The sector with the third highest employment is Finance, Insurance, and Real Estate, or the F.I.R.E. sector, which is followed by manufacturing, construction, and local government (which includes public education). There is a common perception in Montana that the state’s economy is deteriorating, with many citing the growth in service and retail trade jobs and the loss of other “good” jobs in the economy. In actuality, the changing mix of jobs in Montana closely parallels the changing mix of jobs in the larger Rocky Mountain West region; which has seen significant gains in economic performance in recent years. In the last decade while service jobs grew by 37 percent in the fast-growing Rockies, they grew by 42 percent in Montana. And, while services and retail trade now account for nearly half of all jobs in the Rockies, they accounted for 49 percent of jobs in Montana in 2000. When you compare employment trends in Montana with the larger Rocky Mountain region, there are differences. F.I.R.E. is also the fourth highest major sector of employment rather than third as in the Rockies. Manufacturing is seventh, rather than fourth. And farm and ranch employment is sixth in Montana rather than twelfth.
Region Economic Restructuring: Greatest Growth and Greatest Decline There are more than 70 different “sub-sectors” of the economy and the ways in which the economy is ‘restructuring” can be viewed by identifying where the “biggest gains” and “biggest losses” are occurring. In the fast-growing Rocky Mountain West region, labor income growth has been focused in “business services” (including such areas as accounting, advertising, computer, management services, etc.), F.I.R.E. non-depositories (insurance, real estate, brokers, etc.), health care services (doctors and hospitals), special trade contractors (carpenters, plumbers, electricians, etc.), communications (telephone, radio and television, etc.), and engineering and management services; all with gains in excess of $2 billion. Declines were focused in U.S. military, transportation equipment manufacturing other than autos, agriculture, railroads, and mining. SUB-SECTOR CHANGE IN ROCKIES, ’87 – ‘97 Fast-Growing Sub-Sectors (2000 dollars) #1 Business services +$5.8 bil. +130% #2 F.I.R.E., other than depos. + $4.5 bil. +108% #3 Health care services + $4.4 bil. + 64% #4 Special trade contractors + $3.4 bil. + 88% #5 Communications + $2.8 bil. +103% #6 Engineering & managmt serv. + $2.6 bil. + 78% #7 Eating & drinking places + $1.4 bil. + 57% #8 Electric, gas & sanitary serv. + $1.0 bil. + 60% #9 Auto dealers & service stations + $1.0 bi. + 51% +$27.0 (53%) Declining Sub-Sectors Oil & gas expl. & extract. - $ 38 mil. - 2% Coal Mining - $116 mil. - 13% Railroads - $136 mil. - 13% Net farm income - $216 mil. - 10% Transpt. Equip. mfg., not autos - $439 mil. - 25% U.S. Military - $570 mil. - 17%
Fast-Growing and Declining Sub- Sectors in Montana Big Changes in the Economy The one constant in the economy, as in life, is change. And change in the economy seems to be accelerating. Different segments of the economy are affected differently by these changes. Some are expanding rapidly, while others decline. There are over 75 individual sub-sectors of the economy. The chart above shows which of these are fast-growing or declining during the decade of the ‘90s – a period of accelerated growth and fairly dramatic economic restructuring. Growth is most heavily focused in a wide range of service sub-sectors – particularly health care, business services, engineering and management services, and social services. Areas of finance, insurance, and real estate, as well as construction also are fast-growing. Only sixteen of the more than 75 sub-sectors of the economy, listed in the top portion of the chart above, accounted for two-thirds of all growth in labor earnings in Montana during the ‘90s. Conversely, decline in the economy is concentrated in an even smaller number of sub-sectors and most are longstanding industries. These include the natural resource industries of mining, logging and wood products, and agriculture. Also included is railroads and the U.S. military, which has been consolidated throughout the West.
Major Population Centers or Region “Cores” and Closely-Linked Counties in the West
Urban/Rural Features of Population Growth in Montana While most Montanan’s don’t think of the state as being “urban,” most of the state’s population lives in or nearby one of the state’s seven principal population centers. Montana has seven major population centers including Billings (Yellowstone), Missoula (Missoula), Great Falls (Cascade), Helena (Lewis and Clark), Butte (Silver Bow), Bozeman (Gallatin), and Kalispell/Whitefish (Flathead). While small by national standards, most of these cities and the city regions surrounding them are growing. As they do, they’re achieving market area population thresholds necessary for sustained growth and economic diversification. The chart at the right shows population growth among Montana’s city regions. The multi-county areas included in each, shown in the previous map, include the area’s regional center or core county and surrounding counties closely-linked to these regional centers. Twenty-eight of Montana’s 56 counties are closely-linked to one of the state’s seven regional centers. The remaining 21 counties are more isolated and rural areas, largely in the north central and eastern half of the state. The lower chart shows population growth in Montana since 1980 by county type: regional centers, closely-linked, and rest of state. Recent population growth is focused in regional centers and their surrounding areas. The greatest growth is in the Billings, Missoula, Kalispell, Bozeman, and Helena regions. Growth is flat in the Great Falls region, heavily dependent upon agriculture and the Malmstrom Air Base. The Butte region, historical center of Montana’s mining industry, also is flat. Much of the rest of Montana – the more isolated, more rural, and more agriculturally dependent portions of the state, largely in the East – is experiencing steady population decline.
City-Centered Growth in Montana Most who live in Montana live in or nearby the state’s seven largest population centers. In fact, today, more than 60 percent of the state’s population lives in the seven counties where its major population centers are located. Another quarter of the population live in counties surrounding these regional centers and are closely-linked to these centers economically and socially. This means that less than 14 percent of the state’s population lives in relatively isolated areas with small populations.
Economic Change: Urban-to-Rural in Montana As the economy has changed and shifted, its has increasingly focused income growth and employment growth in the state’s largest cities and their surrounding areas. Personal income in the seven regional center counties, which grew by less than $1.2 billion during the‘80s, expanded by over $3.8 billion in the ‘90s – a more than three-fold increase in growth. The pace of income growth in closely-linked counties surrounding these centers more than doubled. Around 96% of all income growth and employment growth in Montana during the last decade occurred in and around its seven regional centers.
Long-term Consolidation and Decline in the Region’s Natural Resource Industries For much of the state’s history, Montana has depended on three pillars of the economy - agriculture, mining, and wood products. The chart at the right shows inflation-adjusted labor earnings for each of Montana’s natural resource industries since 1980. Included in the chart are farm and ranch production (“net farm income”), wood products manufacturing, and three sub-sectors of mining (metals and non-metal/non-fuels, oil and gas, and coal mining). Year-by-year earnings in agriculture have been erratic. Wood products earnings are flat or declining, as is the case with metals and non-metals mining and oil and gas. And while more coal is mined in Montana almost each year, it is usually done with fewer workers and labor earnings by these workers are flat or declining. In spite of this decline or stagnation in the state’s natural resource industries, the larger economy of the state has continued to grow. The chart in the lower right shows total personal income and statewide labor earnings in relation to the combined labor earnings of all natural resource industries for each year since 1980. What’s more, growth in income and labor earnings has accelerated over the course of the last decade. The state’s resource industries continue to be important to Montana’s overall economic prosperity. However, the state’s narrow dependence on these industries is declining and future growth will largely occur in other segments of the economy. However, some areas of Montana, particularly isolated rural areas in the East, will continue to be narrowly dependent on one or more of these industries.
Montana’s Natural Resource Industry Dependence While the state’s resource industries are very important components of the economy, Montana’s economic dependence on these industries is steadily declining. This reflects both long-term decline in these industries and expansion and diversification of the economy in other sectors.
Shifts in the Economy and Restructuring Changes in Montana and in the larger economy are favoring growth in health care; business, engineering, and management services; finance, insurance, and real estate; and construction. Their share of all labor earnings in Montana rose from 12% in the early ‘80s to over 23% by 2000. Industry decline or consolidation is occurring in mining, logging and wood products, and agriculture. These natural resource industries’ share of statewide labor earnings fell from over 13% in the early ‘80s to 6% by 2000.
Montana’s Struggling Ag Sector Agricultural producers in Montana have produced and sold just under $1.9 billion in crops and livestock annually in recent years, with receipts from livestock sales of over $1.1 billion and receipts from crop sales of $600 to $800 million. Their production expenditures, however, have hovered at $2.3 to $2.4 billion a year. Ag profitability hangs in the balance almost each year depending upon the level of farm program payments and “other” farm income, primarily off-farm earnings.
Trends in Ag Profitability in Wyoming and North Dakota Year-to-year profitability in agriculture in nearby states has mirrored trends in Montana. Since the late ‘80s, farmers and ranchers in Wyoming and North Dakota have had positive net farm earnings in most years. However, in most years, profitability entirely hinges upon other income to supplement cash marketing receipts – other income in the form of government farm payments and off-farm income. Year-to-year profitability in production agriculture is very precarious and uncertain. The persistence of this situation is destabilizing the local economies of many communities and areas that are heavily dependent upon farming and ranching. Efforts to reduce annual production expenditures by agricultural producers have been more than offset by steady declines in marketing receipts, largely reflecting erosion in the prices received by producers. Government payments to ag producers along with other farm income now carry much of the burden between farm income gains or losses. Pressures of a thin margin of profitability or loss push agricultural producers toward higher and higher levels of output and production which, in turn, works to dampen prices for farm commodities. This cycle works as a heavy drag on many rural economies of the region.
The Region’s Struggling Ag Sector Farmers and ranchers each year produce and sell around $30 billion in livestock and crops in the 8-state region. However, their expenses oftentimes exceed their cash marketings. And any reductions in expenditures over time have been off-set by reductions in receipts, as shown in the chart below. The split between cash marketing receipts from crops versus livestock is shown in the top right chart, with crop receipts exceeding those from livestock. And, from one year to the next, without the benefit of income other than these marketing receipts, the region’s farmers and ranchers would oftentimes lose money, as shown in the bottom right chart. Government farm program payments to producers have been just under $5 billion annually in recent years. These plus “other income” (off-farm earnings primarily) in many years provide the margin of difference in overall net farm earnings.
Montana’s Struggling Farm and Ranch Sector In Montana as in most other agricultural regions of the U.S., production agriculture has been struggling. Total cash receipts from agricultural sales on a year-to-year basis regularly fall below total production expenses and the difference in net gains or losses is determined by income of agricultural producers from other sources including government farm programs.
The Struggling Farm and Ranch Sectors In Montana and Wyoming, agriculture has been struggling. Farmers and ranchers operate on a thin or non-existent margin of profitability, with year-to-year sustainability riding on farm program payments and sources of income other than cash receipts on marketings. In fact, ag production costs in any given year usually exceed cash receipts from all marketings of livestock and crops.
Regional Distribution of the Fast-growing Services Sector With service sector growth dominating all other sectors in employment growth in Montana and the larger region, it alone is having a major impact on the distribution of the larger economy of the state. The chart at the right shows major sub-sectors of the services sector and their labor earnings growth since the last ‘80s. Health care services are the single largest component and dwarf all other service sub-sectors. Far behind in second place within this sector is business services, followed by engineering and management services. There is little doubt that growth in these areas would favor urban areas and city-region size population and market areas. The lower chart shows the distribution and growth of service sector labor earnings for the state’s regional center counties, counties closely-linked to these urban areas, and the rest of the state. Service sector activity has been steadily expanding in the regional centers, doubling in size between 1980 and the mid-1990s and continuing to grow. Services activity in counties closely-linked to these regional centers grew beyond activity in the rest of the state in 1989. This gap has steadily widened since then. Together, the seven regional centers and their closely-linked counties accounted for 95 percent of all service sector growth in Montana during the last decade. To the degree that economic expansion in Montana continues to be focused in services and other trade sectors, such growth will continue to concentrate more and more of the state’s overall economy in and around these regional centers.
Cities as “Employment Centers” While employment growth is focusing in cities, those working in these jobs live both in the cities and outside of them in surrounding communities. In 2001 $222 million in labor income, earned by persons residing outside of regional center counties but working at jobs located in them, was transferred into the personal income bases of surrounding, closely-linked counties in Montana.
Urban-Rural Differences in Economic Well-being While Montana ranks very low in comparisons of “state” per capita incomes, income levels for most of Montana’s regional population centers compare favorably to levels of other comparable size cities throughout the West. The average per capita income for the seven regional center counties has risen steadily from less than $20,000 in the late ‘80s to just under $26,000. Levels in outlying and isolated rural areas lag behind. However, these gaps between urban and rural income levels are common throughout the West.
Lessons to Learn from Emerging Economic Patterns Look Forward Promising strategies for economic improvement must reflect where the economy is going, not where it has been. Customize Strategies Needs and opportunities vary widely from place to place. Goals and strategies must likewise vary. Cities Matter Recognizing that most growth is focusing in and around “city regions,” more attention needs to be focused on the needs of cities as the “settings” if not the “engines” of economic growth, diversification, and advancement. In Montana, we need to assist cities, not deny that we have any. Urban-Rural Relations Matter Pursuing economic development town-by-town or county-by-county is difficult. Influencing local economies sub-region by sub-region with healthy urban-rural partnerships has potential. Become “Learning Communities” Successful businesses are adaptive businesses. Successful communities are adaptive communities. Adaptive communities must be “learning communities,” keeping abreast of change. Think about “Regional Positioning” Local economies can’t be remade by local leaders. What they can do is find ways of better positioning themselves – businesses, schools, work forces, governments, families – for future change. Anticipate future change and position yourself for it. Human-Resource Based Economy The economy is less and less “natural resource based,” and more and more “human resource based.” Do we know how to invest in human resource development? Well-designed, well-funded, adaptive systems for education and work force development are essential for economic prosperity. Environment as a “Key Economic Asset” In the new economy, a quality environment is a key economic asset. Protecting and enhancing environmental qualities is not the enemy of economic development. It is essential for economic prosperity.
Total Tax Revenues in Montana In actual dollars or dollars unadjusted for inflation, state and local tax revenues from all sources have steadily risen over time, as shown in the top chart. This rise is much less pronounced when these dollar amounts are adjusted for inflation, as shown in the lower chart. Source: 1998 – 2000 Biennial Report, Montana Dept. of Revenue
Montana Tax Revenues as a Share of Income Actual tax collections as a share of total personal income reflect the size of the state’s tax burden in relation to the size of Montana’s economy. Tax revenues as a share of income Have steadily fallen from as high as 10.24% in 1985 to a low of 7.78% in 2002. State revenues are not growing as fast as are incomes. Source: 2000-2002 Biennial Report, MT Department of Revenue
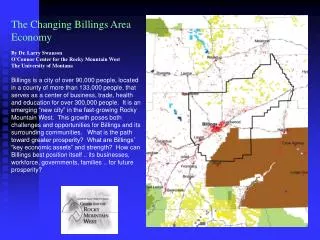
The Changing Billings Area Economy By Dr. Larry Swanson O’Connor Center for the Rocky Mountain West The University of Montana Billings is a city of over 90,000 people, located in a county of more than 133,000 people, that serves as a center of business, trade, health and education for over 300,000 people. It is an emerging “new city” in the fast-growing Rocky Mountain West. This growth poses both challenges and opportunities for Billings and its surrounding communities. What is the path toward greater prosperity? What are Billings’ “key economic assets” and strength? How can Billings best position itself .. its businesses, workforce, governments, families .. for future prosperity?
Regional Trade and Service Areas of Montana’s Largest Cities
Regional Trade and Service Areas of Montana’s Largest Cities
Yellowstone’s Population: 1990 versus 2000 by Single Ages The chart shows total population by singles ages for the two years and, in doing so, shows where population gains or losses occurred during the ‘90s. Growth is focused among adults between their late 30s and mid-50s – classic “baby boomers” or persons born between 1946 and 1964. Growth also is focused among older youth – persons in their teens and early 20s. There are actually fewer persons in their late 20s and early 30s.
Lewis & Clark Population in 1990 versus 2000 by Single Age The chart shows the county’s total population by single age ten years apart. Population growth is concentrated among persons at ages between their early 40s and early 60s (“baby boomers”), as well as among younger adults and children in their teens and early 20s.