Fertilizer
N. P. TEMPORAL AND SPATIAL TRENDS IN NITROGEN AND PHOSPHORUS INPUTS TO THE WATERSHED OF THE ALTAMAHA RIVER. Sylvia C. Schaefer and Merryl Alber Department of Marine Sciences, University of Georgia, Athens, GA. Abstract. Results: Temporal Trends. Results: Spatial Trends.

Fertilizer
E N D
Presentation Transcript
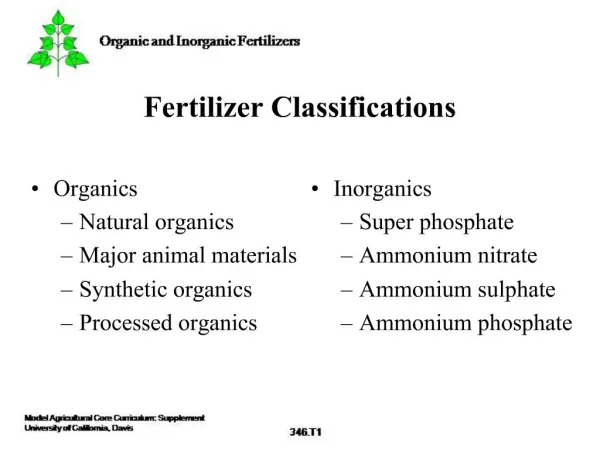
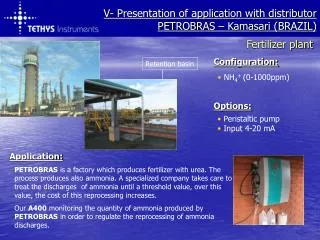
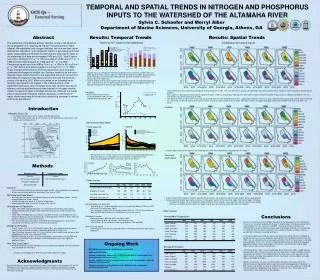
N P TEMPORAL AND SPATIAL TRENDS IN NITROGEN AND PHOSPHORUS INPUTS TO THE WATERSHED OF THE ALTAMAHA RIVER Sylvia C. Schaefer and Merryl Alber Department of Marine Sciences, University of Georgia, Athens, GA Abstract Results: Temporal Trends Results: Spatial Trends The watershed of the Altamaha River, Georgia, is one of thelargest in the southeastern U.S., draining 36,718 km2 (including parts of metro Atlanta). We calculated both nitrogen (fertilizer, net food and feed import, atmospheric deposition, and biological N fixation in agricultural and forest lands) and phosphorus (fertilizer and net food and feed import) inputs to the watershed for 6 time points between 1954 and 2002. Total N inputs rose from 1,943 kg N km-2 yr-1 in 1954 to a peak of 3,584 kg N km-2 yr-1 in 1982 and then declined again to 2,566 kg N km-2 yr-1 by 2002. Phosphorus inputs rose from 408 kg P km-2 yr-1 in 1954 to 531 kg P km-2 yr-1 in 1974 before also declining again, to 410 kg P km-2 yr-1 in 2002. These changes were primarily driven by agricultural inputs and were dominated by changes in fertilizer use. Fertilizer tended to be the most important input of both N and P to the watershed, although net food and feed import increased in importance over time and was the dominant source of N input by 2002. When considered on an individual basis, fertilizer input tended to be highest in the middle portions of the watershed (Little and Lower Ocmulgee and Lower Oconee sub-basins) whereas net food and feed imports were highest in the upper reaches (Upper Oconee and Upper Ocmulgee sub-basins). Although the overall trend in recent years has been towards decreases in both N and P inputs, these trends may be offset due to continuing increases in animal and human populations. Total N and P inputs to the watershed Distribution of nutrient inputs • Nitrogen inputs to the Altamaha watershed showed an overall increase between 1954 and 2002. Inputs of N were actually highest in 1982 and then declined by 2002. Total phosphorus inputs showed an increase between 1954 and 1974. By 2002, however, P inputs had decreased to near-1954 levels. • Fertilizer tended to be the most important input of both N and P to the watershed during most years, and hence was also the primary driver of change in the overall budget. However, net food and feed import has become more important over time. • Total nutrient inputs were fairly evenly distributed among sub-basins in 1954. Over time, differences among sub-watersheds increased, primarily due to changes in human population and agricultural practices. • Most sub-basins followed the overall trend of a peak in N inputs in 1982 as compared to 1954 and then either held constant or declined by 2002. P inputs to most sub-basins peaked in 1974 and then decreased to levels below those of 1954. • The atomic N:P ratio of inputs to the watershed was generally lower than the Redfield Ratio of 16:1, suggesting N limitation. However, P inputs remained relatively constant while N inputs increased. As a consequence, the N:P ratio of inputs increased from 10.5 to 13.8 (with a peak of 18.3 in 1982). The Lower Oconee and Upper Ocmulgee tended to have higher N:P ratios than other sub-basins. • Fertilizer • Sales of both N and P fertilizer increased between 1954 and 1977 and then declined again by 2001 Introduction Fertilizer • Altamaha River, GA • Formed by the confluence of the Oconee and Ocmulgee Rivers • One of the largest watersheds on the east coast of the United States (36,718 km2), and includes parts of metro Atlanta Net food and feed import Cropland Human population • Fertilizer inputs tended to be highest in the middle portions of the watershed, where crop production was highest. Food and feed import • The increase in net N and P import is the result of increasing human population and a concurrent decrease in crop production due to declines in agricultural lands • Shifts in animal population were also a factor, albeit a smaller one Methods Other sources • Fertilizer • N and P content of fertilizer was based on county-specific sales, weighted by the proportion of each county located within the watershed. Data source: USGS • Net Food and Feed Import • Net Food and Feed Import is the difference between total consumption (human + animal) and total production (crop + animal). • Animal and crop data source: U.S. Census of Agriculture • Human population data source: U.S. Bureau of the Census • Atmospheric N Deposition • 1982, 1992, 2002 inorganic deposition was calculated by interpolating from National Atmospheric Deposition Program (wet) and Clean Air Status and Trends Network (dry) stations. • 1954, 1964, 1974 deposition was hindcast using EPA estimates of nationwide emissions. • Organic N deposition was estimated as 30% of total deposition (Neff et al. 2002); following SCOPE, half was assumed to be new input. • 25% of N volatilization from manure (calculated from animal populations) and fertilizer (calculated from fertilizer sales) was assumed to be exported • Biological N Fixation • Crop N fixation: U.S. Census of Agriculture county totals were weighted by proportion of county inside watershed; estimates multiplied by published N fixation rates. • Forest N fixation: calculated from U.S. Forest Service Forest Inventory and land cover data, multiplied by N fixation rates following SCOPE. • Biological N fixation by kudzu, an invasive leguminous vine common in the southeastern U.S., was not included in these budgets but could potentially represent a significant additional N input. • Non-food Crop Export • N and P production in cotton and tobacco was assumed to be exported from the watershed and subtracted from total inputs • Import of both N and P followed a pattern opposite that of fertilizer: sub-watersheds with the lowest imports led in crop production • Net food and feed imports were highest in all years in the upper reaches of the watershed (Upper Oconee and Upper Ocmulgee) • The Upper Ocmulgee, site of a substantial portion of Atlanta and its suburbs, saw a dramatic increase in human consumption. • In contrast, net food and feed import in the Upper Oconee was dominated by increased animal consumption. • Net atmospheric N deposition • Total atmospheric nitrogen deposition rose most dramatically between 1954 and 1974, after which it increased only slightly. • Net atmospheric N deposition increased between 1954 and 1974, but then decreased again by 2002 due to increases in volatilization from animal manure • Biological N fixation • Declined between 1954 and 2002, with high in 1982. • Patterns primarily driven by changes in N fixation by crops • Total N fixation in forestland decreased overall between 1974 and 2002 • Non-food crop export • Generally quite small, but unusually high values in 1964 due to extremely high tobacco production Other sources Conclusions Atmospheric N deposition • Increases in watershed nutrient loading took place in the early portion of the study period. These results are driven largely by the change in fertilizer input, which decreased by half or more between 1977 (the high point) and 2001. The overall increase in fertilizer use coincided with a decline in agricultural land—both crop and pastureland—in the watershed. It is likely that there has been an increase in the amount of fertilizer used per unit area, possibly due to changes in growing techniques. • The relative importance of different sources of nitrogen has shifted over time. Biological N fixation by crops was the most important source of new N to the Altamaha watershed in the 1950s, but was replaced by increasing inputs of fertilizer N and then by increases in net food and feed import. There is less and less cropland producing food and feed for the growing populations of both animals and people in the Altamaha, resulting in the need to import those nutrients from outside the watershed. • Current phosphorus inputs are not substantially above those of the 1950s, suggesting that nitrogen inputs are a more pressing concern in the watershed. To reduce nitrogen, attention should focus on fertilizer in the middle portion of the watershed, animal agriculture in the Upper Oconee, and urban and suburban sources (wastewater treatment plants and septic tanks) in the Upper Ocmulgee. • Whether or not further increases in nutrient inputs take place in the watershed of the Altamaha River will depend on trends in agriculture and human populations. Populations of both humans and animals are likely to continue to increase, and the production of food and feed to sustain those populations may also have to intensify. Thus, further increases in nutrient inputs to the watershed can be expected. Ongoing Work Biological N fixation • MATLAB-based program to simplify budget calculations • Updated 2007 budgets • Evaluate relationships between NO3- isotope composition in riverine export and watershed inputs for the east coast • Use NO3- isotopes to provide insight into N sources and transformations within the Altamaha River watershed • Paired measurements of denitrification in the Altamaha and a comparable northeastern watershed (Based on methodology of SCOPE Nitrogen Project, Boyer et al. 2002) Acknowledgments We thank Beth Boyer for advice on calculating nutrient inputs, Karen Payne for assistance with GIS, and Tim Hollibaugh for useful discussions and being completely awesome. Funding was provided by the Georgia Coastal Ecosystems LTER Project (NSF Award OCE 99-82133) and the Environmental Protection Agency (STAR Grant #R830882).