
Uploaded by
elysia
1 SLIDES
159 VUES
10LIKES
p = 0.008
DESCRIPTION
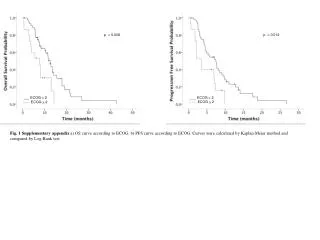
p = 0.008. p = 0.012. ___ ECOG < 2 - - - ECOG > 2. ___ ECOG < 2 - - - ECOG > 2. Fig. 1 Supplementary appendix a) OS curve according to ECOG. b ) PFS curve according to ECOG. Curves were calculated by Kaplan-Meier method and compared by Log- Rank test.
Download
1 / 1
Télécharger la présentation 
p = 0.008
An Image/Link below is provided (as is) to download presentation
Download Policy: Content on the Website is provided to you AS IS for your information and personal use and may not be sold / licensed / shared on other websites without getting consent from its author.
Content is provided to you AS IS for your information and personal use only.
Download presentation by click this link.
While downloading, if for some reason you are not able to download a presentation, the publisher may have deleted the file from their server.
During download, if you can't get a presentation, the file might be deleted by the publisher.
E N D
Presentation Transcript
p = 0.008 p = 0.012 ___ ECOG < 2 - - - ECOG > 2 ___ ECOG < 2 - - - ECOG > 2 Fig. 1 Supplementaryappendix a) OS curve accordingto ECOG. b) PFS curve accordingto ECOG. Curves werecalculatedby Kaplan-Meier methodandcomparedby Log-Ranktest
More Related