Download
1 / 37
370 likes | 538 Vues
A PERFORMANCE EVALUATION OF THE ETA - CMAQ AIR QUALITY FORECAST MODEL FOR THE SUMMER OF 2004. CMAS Workshop Chapel Hill, NC 20 October, 2004. Contributors Brian Eder Daiwen Kang Tanya Otte Hsiu-mu Lin Jon Pleim Shaocai Yu George Pouliot STC Ken Schere Jeff Young ASMD

E N D
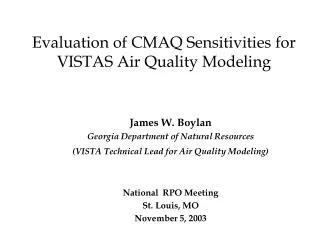
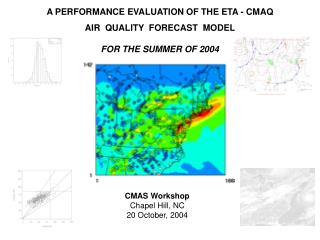
A PERFORMANCE EVALUATION OF THE ETA - CMAQ AIR QUALITY FORECAST MODEL FOR THE SUMMER OF 2004 CMAS Workshop Chapel Hill, NC 20 October, 2004
Contributors Brian Eder Daiwen Kang Tanya OtteHsiu-mu Lin Jon PleimShaocai Yu George PouliotSTC Ken Schere Jeff Young ASMD ARL, NOAA All: On assignment to NERL, U.S. Environmental Protection Agency Disclaimer: “The research presented here was performed under the Memorandum of Understanding between the U.S. Environmental Protection Agency (EPA) and the U.S. Department of Commerce's National Oceanic and Atmospheric Administration (NOAA) and under agreement number DW13921548. Although it has been reviewed by EPA and NOAA and approved for publication, it does not necessarily reflect their policies or views.
Domain Lambert Conformal Projection Models-3 CMAQ 142 ForecastConfiguration - Eta Meteorology - CBIVMechanism - SMOKE Emissions (Offline) - 12 km grid resolution - 22 Vertical Layers - 48 Hr. Forecast (12Z Init.) Simulation Period - 1 May – 30 September 2004 - 1 June – 30 September 2004 (presented here) 166
This performance evaluation used: Hourly O3 (ppb) from EPA’s AIRNOW network: - over 600 stations (mostly urban) - for a four month period (J, J, A, S) A suite of statistical metrics for: - discrete forecasts (MB, NMB, RMSE, NME) - categorical forecasts(A, B, POD, FAR, CSI) of hourly, max. 1-hr and max. 8-hr O3 (presented here).
Discrete Forecast / Evaluation • [Observed] versus [Forecast] • Statistics • - Summary • - Biases MB • NMB • - Errors
Category Forecast / Evaluation Observed Exceedances, Non-Exceedances • versus • Forecast Exceedances, Non-Exceedances Forecast Exceedance No Yes No Yes Observed Exceedance a b c d
Forecast / Evaluation Monthly summaries: - June, July, August, September - Both Discrete and Categorical evaluation Daily summaries: - August 4 -12, Discrete evaluation - Examine performance over a full synoptic cycle - Illustrating both good and poor model performance
Meteorological Conditions for the Summer (J, J, A) 2004 Temperature Precipitation
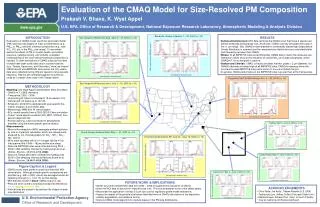
June Summary a b c d
June Summary CorrelationMean Bias (ppb) NMB (%) NME (%)
June Summary 1 15 30
June Summary Bias Error 1 15 30
.01 0.5 1.0 2.0 3.0 Synoptic Scale Meteorology 4 August 20:15
48 Hour Max. 8-Hour OzoneForecast Init: 3 Aug (12 Z) Valid: 4 Aug TP (04 Z to 03 Z) Model performance is poorer along the cold front where cloud cover and heavy rain dominate
.01 0.5 1.0 2.0 3.0 Synoptic Scale Meteorology 5 August 20:15
48 Hour Max. 8-Hour OzoneForecast Init: 4 Aug (12 Z) Valid: 5 Aug TP (04 Z to 03 Z) Model performance is still poor along the cold front where cloud cover and heavy rain dominate
.01 0.5 1.0 2.0 3.0 Synoptic Scale Meteorology 6 August 20:15
48 Hour Max. 8-Hour OzoneForecast Init: 5 Aug (12 Z) Valid: 6 Aug TP (04 Z to 03 Z) Model performance is very good throughout the domain, except for sections of New England and southeast Ontario, where cloud cover is greatest.
.01 0.5 1.0 2.0 3.0 Synoptic Scale Meteorology 7 August 20:15
48 Hour Max. 8-Hour OzoneForecast Init: 6 Aug (12 Z) Valid: 7 Aug TP (04 Z to 03 Z) Model performance is again very good, except for sections of New England, southeast Ontario and Wisconsin, where cloud cover is greatest.
.01 0.5 1.0 2.0 3.0 Synoptic Scale Meteorology 8 August 20:15
48 Hour Max. 8-Hour OzoneForecast Init: 7 Aug (12 Z) Valid: 8 Aug TP (04 Z to 03 Z) Model continues to perform well as the cP airmass undergoes modification. Warmer temperatures allow for higher ozone values (mean observed up to 48.7). New England still has more cloud cover.
.01 0.5 1.0 2.0 3.0 Synoptic Scale Meteorology 9 August 20:15
48 Hour Max. 8-Hour OzoneForecast Init: 8 Aug (12 Z) Valid: 9 Aug TP (04 Z to 03 Z) Good model performance continues, as the cP airmass continues to warm. Highest ozone values (52.9) observed on this day. Cloud cover in New England dissipates resulting in better model performance there.
.01 0.5 1.0 2.0 3.0 Synoptic Scale Meteorology 10 August 20:15
48 Hour Max. 8-Hour OzoneForecast Init: 9 Aug (12 Z) Valid: 10 Aug TP (04 Z to 03 Z) Model performance degrades somewhat as cloud cover and precipitation increases over the domain, most notably with a cold front approaching from the Great Lakes and a low forming over south
.01 0.5 1.0 2.0 3.0 Synoptic Scale Meteorology 11 August 20:15
48 Hour Max. 8-Hour OzoneForecast Init: 10 Aug (12 Z) Valid: 11 Aug TP (04 Z to 03 Z) Model performance continues to suffer over the Great Lakes area as cloud cover, precipitation and very cool temperatures dominate this region.
.01 0.5 1.0 2.0 3.0 Synoptic Scale Meteorology 12 August 20:15
48 Hour Max. 8-Hour OzoneForecast Init: 11 Aug (12 Z) Valid: 12 Aug TP (04 Z to 03 Z) Model performance at its worst as extensive cloud cover, precipitation and very cool temperatures dominate the entire domain.
Summary Model performed reasonably well over the four month period, despite anomalously cool and wet conditions. Performance was closely tied to meteorology: M very good performance when skies were generally clear and void of precipitation, M poorer when cloud cover and precipitation occurred.